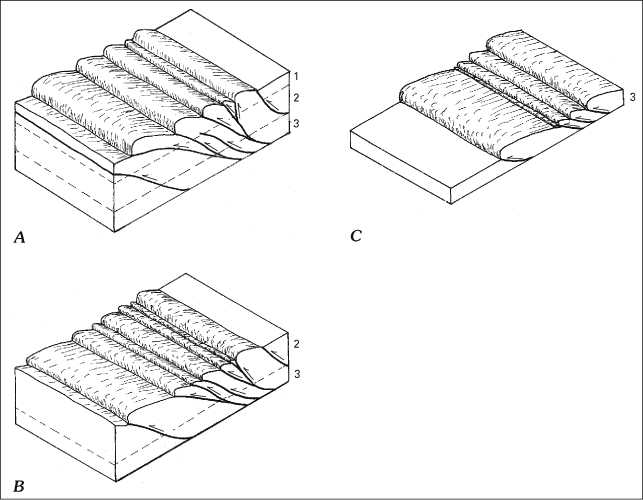
Figure 25. Block diagrams showing the concept of fault spacing and fold size relative to height above décollement, or depth of erosion, indicated by numbered erosional levels. A, Erosional surface 1 is highest above décollement where folds and faults are few and widely spaced, as in the Valley and Ridge province in central Pennsylvania. B, Erosional surface 2 is deeper, or closer to the décollement where folds and faults are more numerous and closely spaced, as in the Valley and Ridge province in Maryland, West Virginia, and Virginia north of the Roanoke lateral ramp. C, Erosional surface 3 is closest to the décollement where folds and faults are fewer and more widely spaced, as in the Valley and Ridge province in Virginia south of the Roanoke lateral ramp.