U.S. Geological Survey: Science for a Changing World - USGS visiaul identifier and link to main Web site at http://www.usgs.gov/

Diagrams showing energy consumption and production in the U.S. A, Energy consumption in 1999. Natural gas, 22.9 percent; coal, 22.5 percent; hydroelectric and other renewable, 7.6 percent; nuclear, 8 percent; petroleum, 39 percent. B, Energy production in 1999. Natural gas, 26.6 percent; coal, 32 percent; hydroelectric and other renewable, 9.9 percent; nuclear, 10.6 percent; petroleum, 20.7 percent. C, Electricity generated in 1999, by all commodities. Natural gas, 9 percent; coal, 56 percent; hydroelectric and other renewable, 9 percent; nuclear, 23 percent; petroleum and other, 3 percent. D, Coal consumption in 1999 by economic sectors. Electric utility, 90 percent; Residential and commercial, 1 percent; industry, 9 percent. E, Forecasted coal consumption by 2020 by electric utilities and other uses. The Energy Information Administration estimates 1,177 million short tons used by utilities and 102 million short tons for other uses. Standard and Poore's Data Respurces, Inc., estimates 1,018 million short tons used by utilities and 111 million short tons for other uses. GRI/Hill, Gas Research Institute estimates 678 million short tons used by utilities and 73 million short tons for other uses. The WEFA Work Group estimates 919 million short tons used by utilities and 86 million short tons for other uses. Actual figutes for 1999 are 944.4 million short tons used by utilities and 100.8 million short tons for other uses

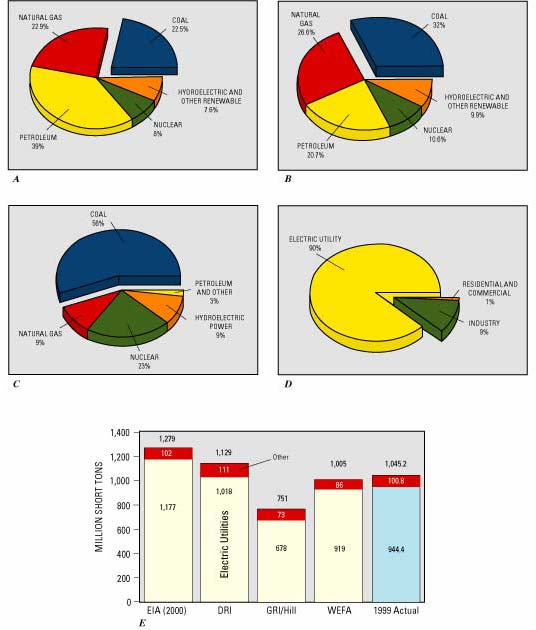
Figure 2. Diagrams showing energy consumption and production in the U.S. A, Energy consumption in 1999. Of the various commodities consumed, approximately 54 percent of the oil and 16 percent of the natural gas are imported; the coal and other commodities are almost entirely domestic. B, Energy production in 1999. C, Electricity generated in 1999, by all commodities. D, Coal consumption in 1999 by the economic sectors shown. E, Forecasted coal consumption for 2020 by electric utilities (yellow) and other uses (red). The basis for comparison of commodities in diagrams A, B, and C is quadrillion Btu, or "quads." Total quads produced and consumed in 1999, were, respectively, 72.5 and 96.6. The basis for diagrams D and E is million short tons. EIA, Energy Information Administration; DRI, Standard & Poor's Data Resources Inc.; GRI/Hill, Gas Research Institute; WEFA, The WEFA Group. Data from Energy Information Administration (1999a, 2000).

U.S. Department of the Interior, U.S. Geological Survey
URL: https:// pubsdata.usgs.gov /pubs/circ/c1143/html/fig2.html
For more information, contact Stanley Schweinfurth
Maintained by Eastern Publications Group
Last modified: 12:28:56 Wed 23 Nov 2016
Privacy statement | General disclaimer | Accessibility