National Water-Quality Assessment (NAWQA) Program
The mission of the U.S. Geological Survey (USGS) is to assess the quantity and quality of the earth resources of the Nation and to provide information that will assist resource managers and policymakers at Federal, State, and local levels in making sound decisions. Assessment of water-quality conditions and trends is an important part of this overall mission.
One of the greatest challenges faced by water-resources scientists is acquiring reliable information that will guide the use and protection of the Nation's water resources. That challenge is being addressed by Federal, State, interstate, and local water-resource agencies and by many academic institutions. These organizations are collecting water-quality data for a host of purposes that include: compliance with permits and water-supply standards; development of remediation plans for specific contamination problems; operational decisions on industrial, wastewater, or water-supply facilities; and research on factors that affect water quality. An additional need for water-quality information is to provide a basis on which regional- and national-level policy decisions can be based. Wise decisions must be based on sound information. As a society we need to know whether certain types of water-quality problems are isolated or ubiquitous, whether there are significant differences in conditions among regions, whether the conditions are changing over time, and why these conditions change from place to place and over time. The information can be used to help determine the efficacy of existing water-quality policies and to help analysts determine the need for and likely consequences of new policies.
To address these needs, the U.S. Congress appropriated funds in 1986 for the USGS to begin a pilot program in seven project areas to develop and refine the National Water-Quality Assessment (NAWQA) Program. In 1991, the USGS began full implementation of the program. The NAWQA Program builds upon an existing base of water-quality studies of the USGS, as well as those of other Federal, State, and local agencies. The objectives of the NAWQA Program are to:
This information will help support the development and evaluation of management, regulatory, and monitoring decisions by other Federal, State, and local agencies to protect, use, and enhance water resources.
The goals of the NAWQA Program are being achieved through ongoing and proposed investigations of 60 of the Nation's most important river basins and aquifer systems, which are referred to as study units. These study units are distributed throughout the Nation and cover a diversity of hydrogeologic settings. More than two-thirds of the Nation's freshwater use occurs within the 60 study units and more than two-thirds of the people served by public water-supply systems live within their boundaries.
National synthesis of data analysis, based on aggregation of comparable information obtained from the study units, is a major component of the program. This effort focuses on selected water-quality topics using nationally consistent information. Comparative studies will explain differences and similarities in observed water-quality conditions among study areas and will identify changes and trends and their causes. The first topics addressed by the national synthesis are pesticides, nutrients, volatile organic compounds, and aquatic biology. Discussions on these and other water-quality topics will be published in periodic summaries of the quality of the Nation's ground and surface water as the information becomes available.
This report is an element of the comprehensive body of information developed as part of the NAWQA Program. The program depends heavily on the advice, cooperation, and information from many Federal, State, interstate, Tribal, and local agencies and the public. The assistance and suggestions of all are greatly appreciated.
Robert M. Hirsch
Chief Hydrologist
Nutrients are essential for plant and animal growth and nourishment, but the overabundance of certain nutrients in water can cause a number of adverse health and ecological effects. To determine the extent of nutrient and other types of contamination in the Nation's streams and ground water, Congress has appropriated funds for a National Water-Quality Assessment (NAWQA) Program, conducted by the U.S. Geological Survey (USGS). The objectives of the NAWQA Program are to:
These goals are being achieved through investigations in 60 large river basins and aquifer systems, which are referred to as study units. Implementation of study-unit investigations are phased so that data are collected in 20 areas at a time. Investigations in the initial 20 study units began in 1991, and reports are being written in 1996. Another group of study-unit investigations began in 1994, and a third group are scheduled to begin in 1997.
This report is based on data compiled from electronic data bases of the USGS and other Federal, State, and local agencies at locations within the first 20 NAWQA study units. About 12,000 samples collected from wells in the NAWQA study units and five additional USGS study areas were used in the ground-water analysis. Data from streams consisted of more than 22,000 samples collected at more than 300 sites between October 1979 and September 1990.
 (14K GIF)
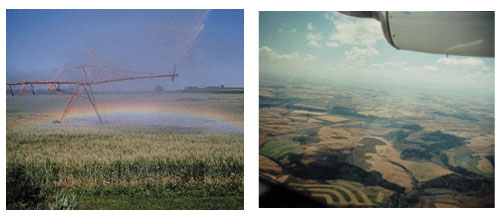
Nitrate concentrations in ground water were highest in the Northeast, Great Plains, and along the West Coast. The agricultural land in these regions is used for intensive row-crop farming, soils are generally well drained, and much of the land is underlain by unconsolidated material, such as sand and gravel, through which water and nitrate can move quickly. These areas receive some of the highest rates of irrigation and fertilizer application in the Nation. Use of inorganic fertilizer is particularly heavy in the Great Plains and West Coast States. Application of manure on croplands is extensive in the Northeast. California has the largest amount of irrigated cropland in the Nation (about 17 percent of the national total), and Nebraska has the second-largest amount. The combination of permeable soils, high rates of fertilizer application, and irrigation provides a large source of nitrate and a high potential for nitrate movement down to the water table.
Nitrate concentrations were generally higher in ground water than in streams. The primary exception was in the Midwest, where poorly drained soils restrict downward water movement and artificial drainage provides a quick path for nutrient-rich runoff to reach streams.
Nitrate concentrations generally are low in both ground water and streams in agricultural areas throughout the Southeast. Poor soil drainage, an abundance of soil organic carbon, warm temperatures, and high rainfall combine to produce conditions that restrict nitrate formation in soils and shallow ground water of this region. Forested buffer strips between and within agricultural fields also are common and might retain nutrients.
Concentrations also are low in ground water and streams of the arid Southwest. The sources of nitrate are limited in this region. Only a small percentage of the region is cultivated; most agricultural areas are used for rangeland and pasture.
 (12K GIF)
 Median nitrate concentrations in streams and shallow ground water in agricultural areas of the 20 NAWQA study units.
The MEDIAN is the middle value of a group of data; half of the data are lower than the median, and half are higher. In this report, we use the median to represent values generally expected for a group of nutrient concentrations.
Ground water provides the drinking-water supply to more than half the population of the United States. Public-supply wells are usually large wells providing water to hundreds of people within towns and cities. Domestic-supply wells usually provide water to a single family on whose property the well is located. Nitrate concentrations for these two types of wells are commonly quite different.
On the basis of samples available within the NAWQA study units, drinking water from public-supply wells and domestic-supply wells outside of agricultural areas is not likely to have high levels of nitrate. Public-supply wells are subjected to regular testing, and if concentrations exceed the U.S. Environmental Protection Agency (EPA) maximum contaminant level (MCL) of 10 mg/L for drinking water, the well is likely to be abandoned.
 (5K GIF)
Nitrate concentrations in wells used to supply drinking water.
Domestic-supply wells in agricultural areas are more prone to elevated concentrations of nitrate. Domestic-supply wells are generally shallower than public-supply wells, making them more vulnerable to contamination from the surface. In agricultural areas, domestic-supply wells often are located near septic systems, agricultural fields, or animal feeding areas, all of which are potential sources of nitrate.
The median nitrate concentration in samples from public-supply wells was less than 0.2 mg/L, well below the MCL for drinking water. Concentrations in only 1 percent of the samples from public-supply wells exceeded the MCL. The highest concentrations were in samples from domestic-supply wells in agricultural areas, where potential sources of nitrate contamination are more prevalent. The median concentration in samples from these wells was greater than "background" levels (2 mg/L), and 12 percent exceeded the MCL. These values are based on data from about 1,100 public-supply wells and about 3,200 domestic-supply wells, two-thirds of which were in agricultural areas. However, data were not available for all wells within each NAWQA study unit, so the percentages may not be identical to those for the entire NAWQA area or the Nation.
Surface WaterFor drinking-water supplies that come from surface-water sources (streams and reservoirs), it is difficult to estimate how often nitrate concentrations can be expected to be above the MCL. Water utilities perform regular analyses of their own supplies and report to State health agencies the date on which a standard was exceeded (an "exceedance"). But State records of exceedances are not always accessible by computer and are not collected or summarized nationally. Concentrations that do not exceed a standard are not reported. Therefore, variations in nitrate concentration are not available as public record.
Where nonpoint sources of nitrate, such as fertilizer applications to fields or lawns, are prevalent upstream from a water-supply intake, nitrate concentrations in the water often are highest when the fertilizer is washed off during storms. Where point sources, such as sewage-treatment plants, are located upstream from a water-supply intake, nitrate concentrations often are highest during low flows when little additional water is available to dilute the nitrate in effluents. However, most water-supply intakes are purposely located upstream from nearby point sources rather than downstream.
Standard water-treatment practices remove very little of the nitrate in drinking water. Water utilities commonly have more than one source of supply, which can be blended to ensure that the concentration of nitrate in water delivered to the public meets drinking-water standards.
 (6K GIF)
The Clean Water Act, the Safe Drinking Water Act, and other legislation have been implemented over the last 20 years to ensure that the people of the United States are provided water that is safe for drinking, swimming, and fishing. Some of the protective measures considered by water-resources managers are quite expensive. Use of these measures could result in higher water utility rates or might involve restrictions on the types and amounts of chemicals applied to nearby land. Scientific information about where, when, and how chemicals enter water supplies can help managers tailor protection strategies to fit the need, and so minimize costs and restrictions.
Although the Clean Water Act has provided funding to curtail nutrient contamination from point sources, primarily sewage-treatment plants, a large percentage of nutrient contamination is caused by nonpoint sources, such as atmospheric deposition, agricultural runoff, and seepage from septic systems. Contamination from nonpoint sources is more difficult to control and has only recently been addressed in national legislation.
 (25K GIF)
Determining where water-quality problems are most likely to occur is the key to devising cost-effective watershed-management strategies. Our findings imply that management strategies need to incorporate some flexibility in different regions of the Nation to provide the greatest benefit for the lowest cost. For example, soil drainage characteristics are a useful guide to where ground water or surface water is most at risk to contamination from nutrients applied at the land surface. Ground water in areas of well-drained soils is vulnerable to contamination as a consequence of surface application of chemicals and warrants more complete protection strategies than in areas of poorly drained soils. We found that nitrate concentrations generally were low in ground water under poorly drained soils, even in NAWQA study areas where fertilizer was heavily applied at the surface. Watershed management of surface water, rather than ground water, might be a priority in these areas.
Ground-water protection strategies also could vary with the depth of wells and geologic characteristics of the area. Only 1 percent of public-supply wells in NAWQA study areas were found to exceed the EPA drinking-water standard for nitrate. In contrast, 12 percent of domestic-supply wells in agricultural areas exceeded the standard. Domestic wells are generally more shallow than public-supply wells, and more frequent exceedances of the nitrate standard are to be expected. Areas where domestic-supply wells are prevalent, and whose geologic characteristics allow easy transmittal of chemicals to ground water, may warrant protective measures not necessary for other parts of the Nation.
Science Can Identify When Nutrient Problems Require Special Management
Concentrations of nutrients sometimes have a distinct seasonal pattern in streams. Concentrations often are highest during storm events soon after application of fertilizers upstream. Other agricultural chemicals in streams follow similar patterns. Protection strategies in areas where these chemicals are of concern might need to be in force only during certain seasons, such as during the spring runoff period.
Science Can Evaluate Whether and By How Much Pollution Control Programs Decrease Nutrient Concentrations
Reducing the amount of nutrients applied to the land could improve the local quality of water. Agricultural scientists are currently considering such methods as varying the timing of fertilizer applications to minimize runoff into streams or pumping high-nutrient, shallow ground water for use as a fertilizer source. Fertilizer management plans are becoming more common as farmers better account for other sources of nutrients present in the soils, such as from nitrogen fixation by soybeans or manure application to cropland. Accounting for these additional sources of nitrogen when determining fertilizer application rates could decrease the excess nutrients in the soil and the amount of nutrients available to surface streams and ground water.
Recent improvements in wastewater treatment have decreased ammonia concentrations downstream from many urban areas. During this treatment, ammonia is converted to nitrate. Consequently, concerns about fish toxicity have decreased, but the potential for eutrophication is not diminished because total nitrogen concentrations remain constant.
Some municipalities have implemented voluntary or mandatory phosphate-reduction programs. Monitoring of phosphate loads has been helpful in determining whether or not these innovative programs make a difference. In Atlanta, for example, the amount of phosphorus in treated sewage effluent decreased by 83 percent in 4 years (1989-93) due to a combination of voluntary and mandatory reductions in phosphate detergents. At the same time, phosphorus loads in the Chattahoochee River downstream from Atlanta decreased by 53 percent.
In this and other cases, water-quality studies can provide scientific data on the economic and ecological benefits of water-management strategies. Without such data, an accurate analysis of benefits compared to costs would not be possible.
 (79K GIF)
No "quick fixes" of long-term nutrient excesses should be expected. Ground water moves slowly, and waters of improved quality may take 30 years or more to move from the surface into nearby streams or wells. A long-term view must be taken. Understanding the regional distribution and key scientific factors that affect nutrient concentrations in ground and surface waters is critical to implementing and evaluating cost-effective programs to manage and protect our water resources.
Contamination of water by nutrients has been a national concern for several decades. The earliest public interest was in lake and reservoir eutrophication, which produces unsightly scums of algae on the water surface and can occasionally result in fishkills. Beginning in the 1970's, additional concern focused on nutrients discharged to streams from sewage-treatment plants. Nutrients in treatment-plant effluent adversely affect aquatic life through direct toxicity and by removing oxygen from water during chemical transformations. The Water Pollution Control Act of 1972, later known as the Clean Water Act, mandated improvements in sewage-treatment technology, to be funded jointly by the Federal, State, and local governments. Twenty years later, the EPA reported that nutrients still were among the two leading causes of water-quality degradation in rivers, lakes, and estuaries throughout the Nation. Also, one particular nutrient compound, nitrate, was reported to be the most prevalent contaminant in ground water nationwide. The other nutrients of concern in water pollution are ammonia and phosphorus.
The EPA has established a maximum contaminant level (MCL) of 10 mg/L (as nitrogen) for nitrate in drinking water. Excessive nitrate can result in restriction of oxygen transport in the bloodstream. Infants under the age of 4 months lack the enzyme necessary to correct this condition. Fatalities from methemoglobinemia ("blue baby syndrome") occur infrequently and are most common in rural areas. Illness and death caused by methemoglobinemia are not always recognized; therefore, its occurrence might be underreported. Although one case in Colorado was attributed to infant formula made from public-supply water that had a nitrate concentration of 13.3 mg/L, most cases involve concentrations that are somewhat higher. In parts of Eastern Europe where ground water is contaminated with 50-100 mg/L nitrate, pregnant women and children under 1 year of age are supplied with bottled water.
 (72K GIF)
The EPA has established criteria for maximum ammonia concentrations in surface water based on danger to aquatic organisms such as fish. These criteria vary with acidity and water temperature, which affect both the toxicity of ammonia and the form in which it occurs. In most natural surface waters, total ammonia concentrations greater than about 2 mg/L exceed the chronic exposure criteria for fish. In alkaline water at high temperature, the criteria can be exceeded by total ammonia concentrations less than 0.1 mg/L. The natural conversion of ammonia to nitrate in streams removes oxygen from water and, therefore, can also adversely affect fish.
 (31K GIF)
 In 1992, the EPA reported that accelerated eutrophication was one of the leading problems facing the Nation's lakes and reservoirs. Eutrophication caused by the overabundance of nutrients in water can result in a variety of water-quality problems, including fishkills, noxious tastes and odors, clogged pipelines, and restricted recreation. In freshwater, phosphorus is often the nutrient responsible for accelerated eutrophication. No national criteria have been established for concentrations of phosphorus compounds in water; however, to control eutrophication, the EPA makes the following recommendations:
 (34K GIF)
The major sources of nutrients to streams and ground water are precipitation, dissolution of natural minerals from soil or geologic formations, fertilizer application, and effluent from sewage-treatment plants. The first three of these are nonpoint sources. Treatment-plant effluent is a point source.
Precipitation
Minerals
Fertilizer
Sewage Effluent
The Earth's atmosphere is about 78 percent nitrogen and contains about three-fourths of the nitrogen available in the environment. Most of this nitrogen is in the form of elemental nitrogen gas, but compounds of nitrogen and oxygen also are present. Some of these compounds are produced by chemical reactions in the atmosphere, and a substantial amount are released into the atmosphere from the combustion of fossil fuel, such as coal and gasoline. Nitrogen compounds in the atmosphere undergo transformations that eventually leave the nitrogen in the form of nitrate. (This process also contributes to the formation of "acid rain.") Nitrate can dissolve in rainwater or snow and then can reach streams or ground water in runoff or seepage. More than 3.2 million tons of nitrogen are deposited in the United States each year from the atmosphere.
 (15K GIF)
 Estimated annual atmospheric deposition of nitrogen. The highest concentrations occur in a broad band from the Northeast through the upper Midwest.
The largest reservoir of phosphorus in the environment is not the atmosphere but minerals in rocks, sediment, and soil. Where natural deposits of phosphorus minerals are mined, such as in Florida and Idaho, runoff and seepage may be a source of phosphorus to streams. In general, however, phosphorus compounds are much less soluble than nitrogen compounds and do not readily move in runoff or seepage.
FertilizerA major human influence on nitrogen and phosphorus in the environment is the use of fertilizers in agricultural and urban areas. Commercial nitrogen fertilizers are applied either as ammonia or nitrate, but ammonia is rapidly converted to nitrate in the soil. Excess nitrate, not taken up by plants, can enter streams or seep down to ground water. Animal manure is also used as a nitrogen fertilizer. Organic nitrogen and urea in the manure are converted to ammonia and, ultimately, to nitrate in the soil. In the Southeast, manure is the single largest source of applied nitrogen, whereas commercial fertilizers are the predominant sources of nitrogen in the Midwest and West. Phosphorus fertilizer generally is applied as a compound of phosphate. Phosphate is not very mobile in soil; it tends to remain attached to solid particles rather than dissolving in water. However, soil erosion can carry a considerable amount of particulate phosphate to streams. About 11 million tons of nitrogen and 2 million tons of phosphorus are applied annually in commercial fertilizer. Another 6.5 million tons of nitrogen and 2 million tons of phosphorus are applied in manure.
 (26K JPG)
 (79K GIF)
 (79K GIF)
 (4K GIF)
Annual sales of commercial nitrogen and phosphorus fertilizer in the United States. Between 1945 and 1985, the use of nitrogen fertilizer increased twentyfold. The use of phosphorus fertilizer increased about fourfold between 1945 and 1980. During 1989-93, the annual use of both fertilizers remained fairly constant.
 (15K GIF)
 (15K GIF)
Estimated application of nitrogen in commercial fertilizer and manure
during 1987. The highest application rates occurred over a broad area
of the upper Midwest. Other areas of high application were along the
East Coast, throughout the Southeast, and in isolated areas of the
West.
Organic nitrogen, ammonia, and organic phosphorus are present in sewage and in sewage-treatment-plant effluents. During 1978-81, sewage-treatment plants discharged about 1.3 million tons of nitrogen per year to the Nation's waters, and other industrial point sources discharged an additional 0.3 million tons per year. Phosphate also occurs in sewage as a component of detergents and other cleaning products. About 0.3 million tons of phosphorus per year was discharged during 1978-81. Between 1980 and 1990, the Nation's population grew by about 10 percent, so sewage discharges also may have increased.
Nutrients in sewage effluent have been among the primary targets of pollution-control legislation, beginning with the Clean Water Act in 1972. The organic forms have largely been controlled through upgrading treatment plants. Advanced treatment processes have been used to decrease ammonia discharge in some areas. But these processes result in an increase in nitrate discharge, so the total nitrogen discharge does not change. Phosphate is expensive to remove from effluent, so it has been controlled primarily by limitations or "bans" on phosphate in detergents.
 (118K GIF)
Whenever concentrations of any chemical in water are discussed, one of the first questions asked is, "How much is there naturally?" One way to answer this question is to measure concentrations in relatively pristine waters. Such waters are difficult to find. In our analysis, we used land-use classifications to identify areas of the Nation that were mostly undeveloped, and so minimally impacted by agriculture, cities, and associated human activities. Samples from wells in forest areas and from streams draining predominantly forests and rangelands were selected to evaluate the natural occurrence, or "background levels," of nutrients in water.
 (5K GIF)
 These are the concentrations that can be expected in the absence of significant human influence. Concentrations exceeding these values generally were found in samples from streams and wells in agricultural or urban areas, or in areas potentially affected by atmospheric deposition or phosphate mining.
 (69K JPG)
Ammonia concentrations usually were less than 0.1 mg/L in ground-water and stream samples from background sites. Ammonia is not a stable nutrient in most environments. It is easily transformed to nitrate in waters that contain oxygen and can be transformed to nitrogen gas and released to the atmosphere in waters that are low in oxygen. So it is not surprising that natural concentrations of ammonia are low.
Nitrate concentrations in samples from background sites generally were less than 2 mg/L for ground water and less than 0.6 mg/L for streams. Concentrations in streams were higher in the Northeast than in other parts of the Nation. Atmospheric deposition has been cited by past studies as providing more nitrogen in rainfall to land in the Northeast than in other parts of the Nation, and our analysis supports that conclusion.
 (7K GIF)
Median nitrate concentrations in streams draining undeveloped areas
(forest and rangeland) in NAWQA study units where sufficient data were
available. "Acid rain" might be contributing to the higher nitrate
concentrations in parts of the Northeast.
Concentrations of total phosphorus usually were less than 0.1 mg/L in stream samples from background sites. Information was sparse about phosphorus in ground water, but where available, background concentrations also were less than 0.1 mg/L.
 (80K GIF)
Four major influences on nutrient concentrations in ground water and streams are land use, soil drainage, geology, and depth to ground water.
Land Use
Soil Drainage
Geology
Depth to Ground Water
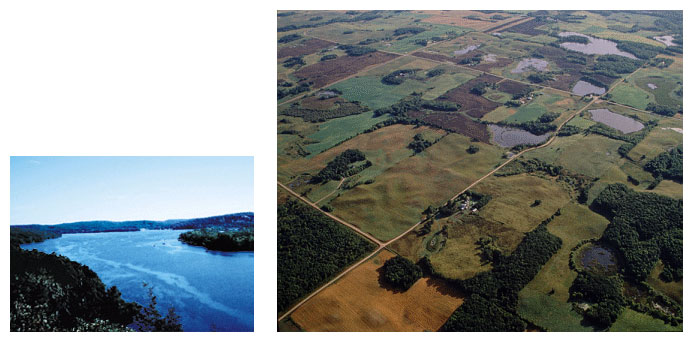
Activities on the land surface may have a considerable effect on both ground water and streams. Nationally, these activities have been grouped into categories of "land use," including forest land, rangeland, agricultural land, urban land, and wetland. Water-quality sampling locations can be assigned to these categories on the basis of land use in the watersheds upstream from surface-water sampling sites or in the vicinity of ground-water wells.
In general, nitrate concentrations in shallow ground water were higher in agricultural areas than in urban, forest, or rangeland areas. Nitrate also was elevated in surface water downstream from agricultural areas, but was not as high as in ground water. Nitrate concentrations similar to those found downstream from agriculture were found downstream from urban areas.
 (140K GIF)
Ammonia and phosphorus concentrations were higher downstream from urban areas than at sites downstream from any other land uses. Concentrations in many urban areas were high enough to exceed criteria or recommendations intended to protect aquatic life and prevent accelerated eutrophication.
In large rivers, such as the Potomac, Rio Grande, or Willamette, nutrient concentrations are usually low. The upstream basins of these rivers contain a mixture of land uses, and high-concentration runoff from agricultural and urban areas can be diluted with low-concentration runoff from undeveloped areas.
 (5K GIF)
Nitrate concentrations are highest in "shallow" ground water (within about 100 feet of land surface). Ground water at greater depths might be protected from surface contamination by intervening rock layers or by the natural transformation of nitrate to nitrogen gas. Deep water also might be low in nitrate because it entered the ground before intensive fertilizer applications became prevalent.
 (7K GIF)
Nitrate concentrations in shallow ground water in agricultural areas
were generally higher than in other areas. Concentrations in 12
percent of the domestic-supply wells in agricultural areas exceeded
the U.S. Environmental Protection Agency maximum contaminant level
(MCL) of 10 mg/L for drinking water. Nitrate concentrations were
higher in agricultural and urban areas than in undeveloped areas,
such as forest and rangeland. However, concentrations generally were
less than those for ground water in similar locations, and the
drinking-water MCL was rarely exceeded.
 (7K GIF)
Ammonia and total phosphorus concentrations were higher downstream
from urban areas. At least 10 percent of the samples from urban sites
contained sufficient ammonia to exceed the chronic exposure criteria
for aquatic life. Total phosphorus concentrations exceeded the limit
recommended by the U.S. Environmental Protection Agency for streams
(0.1 mg/L) in samples from sites affected by urban or agricultural
land uses.
 (64K JPG)
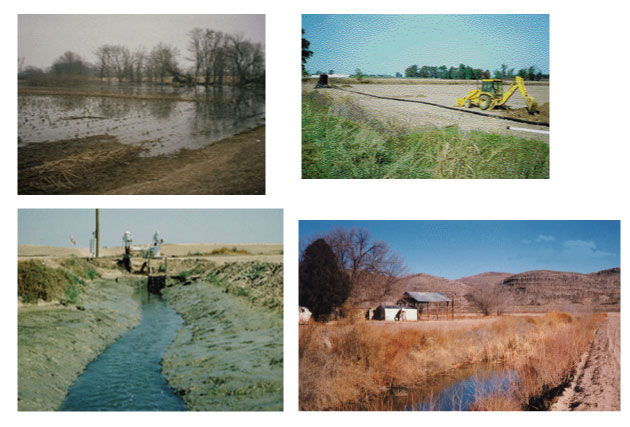
Movement of water from the land surface to aquifers and to streams is affected in part by soil drainage, the ability of soil to transmit water. Soil scientists classify soils by hydrologic group, based primarily on drainage characteristics. Soil hydrologic groups range from A (well-drained soils through which water moves rapidly) to D (very poorly drained soils through which water moves slowly).
Nitrate concentrations in ground water generally are highest beneath soils classified in hydrologic groups A and B, soils with rapid drainage. These soils provide easy pathways for the flow of water and nitrate to the water table. Poorly drained soils in hydrologic groups C and D impede the movement of nitrate to the subsurface in several ways. First, they are generally fine-grained silts and clays, which retard the downward movement of water and, therefore, of nitrate to the water table. Second, tile drains or ditches commonly are used in very poorly drained agricultural fields to remove excess water from the soil. This prevents some nitrate from ever reaching the ground water, instead directing it into nearby streams. In tile-drained areas of the Midwestern Corn Belt, such as in the White River Basin study unit in Indiana, nitrate concentrations in ground water were low, but concentrations in streams were high. Third, water in poorly drained soils is often low in oxygen, which restricts the chemical reaction that converts ammonia to nitrate and favors the chemical reaction that converts nitrate to nitrogen gas. In an extensive area of poorly drained soils on the coastal plain of the Albemarle-Pamlico study unit in North Carolina, nitrate concentrations in ground water were very low, but ammonia concentrations were high.
 (67K GIF)
  (23K GIF)
 Soil drainage is an important factor affecting the movement of water and nitrate to aquifers and streams. This map shows soils classified into four hydrologic groups, based on drainage characteristics. The data were obtained from digital maps produced by the Department of Agriculture's Natural Resources Conservation Service (formerly the Soil Conservation Service) in 1993.
 (6K GIF)
 Nitrate concentrations were highest in ground water beneath well-drained soils.
The type of geologic formations through which ground water passes can affect how easily water and nutrients move downward. Nitrate concentrations in shallow ground water beneath agricultural land differ among four broad types of formations in which the wells were sampled. Nitrate concentrations were highest in ground water from unconsolidated sands and gravels, the formation which, of the four, transmits water most easily. Concentrations were not quite as high in ground water from alluvium (river deposits) or carbonate rock (limestone). These formations do not allow water to move as rapidly down to ground water, though carbonate rock can be fractured or contain solution channels that provide quick connections to the subsurface. Concentrations were lowest in ground water from formations through which water moves very slowly, such as cemented sandstones and crystalline rock (such as granite).
During the past 20 years, many changes have occurred in the human influences on water quality. Population has shifted from the Northeast to the Southwest, fertilizer applications have increased in many agricultural areas, and sewage contamination has been targeted for improvement. What patterns in water quality have been observed, where have these occurred, and to what extent can they be explained?
Ground WaterUnfortunately, little information exists about trends in the quality of ground water. Only recently have monitoring programs begun to sample wells at regular time intervals. Trends in nitrate concentrations can be determined for a few locations, but information on trends in ammonia or phosphorus concentrations in ground water are generally lacking. Clearly, additional information on trends in ground-water quality is needed across the Nation.
A small amount of data was available to evaluate trends of nitrate in ground water for a few NAWQA study units. Shallow wells in central Florida were sampled from about 1972 through 1990. Nitrate concentrations in samples from most wells in agricultural areas increased gradually during that time period. In nearby forested areas, no changes were detected. During an 8-year period in Pennsylvania, nitrate concentrations in shallow wells decreased as nutrient applications were decreased at the surface. Concentrations in a deeper well did not change. Measurements over 10 years at five springs in forested areas of the Ozark Plateau in Arkansas also showed no significant change in nitrate concentrations.
Because there are so few long-term records at wells, recent USGS research has provided a valuable method for determining trends in ground-water quality (Plummer and others, 1993). Samples are taken at different depths or locations in the aquifer. Chemical measurements are used to determine when within the last 30-50 years water in each sample entered the aquifer. Once this "age" of the water is known, the history of nitrate (or contaminants such as pesticides) carried along with the water can be plotted.
The NAWQA Program includes monitoring ground water to identify trends, but several more years of sampling are necessary before enough data will be collected.
 (6K GIF)
 Nitrate concentrations in ground water from agricultural areas in the central Platte River Valley, Nebraska. Between 1974 and 1984, concentrations increased at all depths greater than about 30 feet. The most dramatic increases were in shallow ground water, between 30 and 100 feet below the land surface. Commercial fertilizer applications are heavy in this region (data from the Nebraska Conservation and Survey Division).
 (4K GIF)
Nitrate in ground water under the Delmarva Peninsula of eastern Maryland has responded to changes in fertilizer use. The steep increase in concentration beginning about 1968 follows a sixfold rise in fertilizer application rates between 1951 and 1971. Since then, fertilizer use has remained fairly constant. The nitrate trend is not as steep after 1978 (from Böhlke and Denver, 1995).
Much more data exist for determining nutrient trends in surface waters. A consistent change between 1970 and 1992 is seen in many urban streams across the country. In streams affected by sewage-treatment plants, the proportion of nitrogen present as ammonia has decreased, and the proportion present as nitrate has increased. This pattern appears to be widespread in urban areas throughout the Nation and is a direct result of improvements in sewage-treatment practices mandated by the Clean Water Act. Sewage-treatment processes were improved during the late 1970's and 1980's to convert ammonia into nitrate. As a result, nutrient releases from sewage treatment rarely pose a concern for fishkills, but still may be a concern for eutrophication. The total amount of nitrogen potentially available to algae and other organisms downstream is not necessarily decreased by improved sewage treatment.
A second trend identified in urban streams was a sustained decrease in phosphorus following mandated phosphorus controls in sewage-treatment-plant effluent. Phosphorus decreases were caused by limits on the phosphate content of detergent, which were established to reduce the amount of phosphorus input to treatment plants, and by additional treatment used in a few plants to remove phosphorus. The Potomac River, Chattahoochee River, Connecticut River, and several sites in urban areas west of Lake Michigan all showed decreases in phosphorus concentrations during the 1980's that were attributed to decreased phosphorus in treatment-plant effluent.
 (5K GIF)
During 1974-91, the predominant form of nitrogen downstream from sewage-treatment plants in the Dallas area changed from ammonia to nitrate. This was a direct result of improved treatment processes in the plants (modified from Van Metre and Reutter, 1994).
Trends in water quality also have been noted as agricultural practices have changed. In the San Joaquin Valley of California, fertilizer applications have doubled since the 1950's. The use of tile drains to remove water from fields and deliver it to nearby streams also has greatly increased. The result has been an increase in nitrate concentrations since 1950 in the lower San Joaquin River. The primary difficulty in evaluating trends resulting from changes in farming practices is the lack of data before implementation, because systematic data collection at small farm sites is rare.
Trends in the water quality of large streams routinely monitored by the USGS were evaluated in a National Water Summary report by Smith, Alexander, and Lanfear, published in 1993. Widespread increases in nitrate concentrations occurred during 1974-81, but no nationwide trend was evident during 1980-89. This is not surprising, as fertilizer use generally stayed constant during the 1980's after peaking around 1981.
 (5K GIF)
Trends in nitrate concentration at a site downstream from forested
areas in the Hudson River Basin study unit. Concentrations have
doubled since 1970. The most significant source of nitrogen at these
sites is in precipitation on the upstream watersheds. An increase in
atmospheric deposition of nitrogen has been noted across much of the
Northeastern United States (data from Murdoch and Stoddard, 1992).
This report is based on analyses in U.S. Geological Survey Water-Resources Investigations (WRI) Report 95-4031 (Mueller, D.K., Hamilton, P.A., Helsel, D.R., Hitt, K.J., and Ruddy, B.C., 1995, Nutrients in ground water and surface water of the United States--An analysis of data through 1992, 74 p.).
For copies of WRI Report 95-4031 and additional information on National Water-Quality Assessment (NAWQA) Program studies, contact:
Chief, NAWQA Program
U.S. Geological Survey
Water Resources Division
12201 Sunrise Valley Drive, M.S. 413
Reston, VA 20192
email: gs-w_nawqa_info@usgs.gov
For information on U.S. Geological Survey research dealing with nutrients and water quality, contact:
Chief, Office of Hydrologic Research
U.S. Geological Survey
Water Resources Division
12201 Sunrise Valley Drive, M.S. 436
Reston, VA 20192
Information regarding the NAWQA Program is also available on the Internet via the World Wide Web. You can connect to the NAWQA Home Page for online information, and you can obtain the data sets analyzed to produce the information in this report.
Böhlke, J.K., and Denver, J.M., 1995, Combined use of groundwater dating, chemical, and isotopic analyses to resolve the history and fate of nitrate contamination in two agricultural watersheds, Atlantic coastal plain, Maryland: Water Resources Research, v. 31, no. 9, p. 2319-2339.
Murdoch, P.S., and Stoddard, J.L., 1992, The role of nitrate in the acidification of streams in the Catskill Mountains of New York: Water Resources Research, v. 28, no. 10, p. 2707-2720.
Plummer, L.N., Michel, R.L., Thurman, E.M., and Glynn, P.D., 1993, Environmental tracers for age dating young ground water, in Alley, W.M., ed., Regional Ground-Water Quality: Van Nostrand Reinhold, New York, p. 255-294.
Smith, R.A., Alexander, R.B., and Lanfear, K.J., 1993, Stream water quality in the conterminous United States--Status and trends of selected indicators during the 1980's, in Paulson, R.W., Chase, E.B., Williams, J.S., and Moody, D.W., comps., National water summary, 1990-91--Hydrologic events and stream water quality: U.S. Geological Survey Water-Supply Paper 2400, 590 p.
Coordination among agencies and organizations is an integral part of the NAWQA Program. We thank the following agencies and organizations who contributed data used in this report.
Federal Agencies
State Agencies
Local Agencies
Universities
International Agencies
Environment Canada
Alabama Department of Environmental Management
Arkansas Department of Pollution Control and Ecology
California Department of Water Resources
California Regional Water Quality Control Board
Colorado Department of Health
Florida Department of Environmental Protection
Florida Game and Fresh Water Fish Commission
Georgia Department of Natural Resources
Georgia Environmental Protection Division
Georgia Geologic Survey
Idaho Department of Water Resources
Idaho Division of Environmental Quality
Indiana Department of Environmental Management
Indiana Department of Natural Resources
Kansas Department of Health and Environment
Maryland Department of the Environment
Massachusetts Department of Environmental Protection
Minnesota Department of Agriculture
Minnesota Department of Health
Minnesota Pollution Control Agency
Missouri Department of Natural Resources
Nebraska Department of Environmental Quality
Nebraska Department of Health
Nebraska Natural Resources Commission
Nevada Division of Environmental Protection
New Jersey Department of Environmental Protection
New Mexico Environment Department
New York State Department of Environmental Conservation
North Carolina Department of Environment, Health, and Natural Resources
North Dakota Department of Health
North Dakota State Water Commission
Oklahoma State Department of Health
Oregon Department of Environmental Quality
Oregon Department of Human Resources
Pennsylvania Department of Environmental Resources
Texas Natural Resource Conservation Commission
Texas Water Development Board
Virginia Department of Environmental Quality
Washington Department of Ecology
Washington Department of Health
West Virginia Department of Natural Resources
Wisconsin Department of Natural Resources
City of Albuquerque Public Works Department, New Mexico
City of Arlington, Texas
Bernalillo County Environmental Health Department, Albuquerque, New Mexico
Carson City, Nevada
Clark County Sanitation District, Las Vegas, Nevada
Denver Regional Council of Governments, Colorado
Denver Water Department, Colorado
District of Columbia Department of Consumer and Regulatory Affairs
City of Fort Worth, Texas
Green Bay Metropolitan Sewerage District, Wisconsin
City of Las Vegas, Nevada
Metro Wastewater Reclamation District, Denver, Colorado
Milwaukee Metropolitan Sewerage District, Wisconsin
New York City Department of Environmental Protection
Northern Front Range Water Quality Planning Association, Loveland, Colorado
Portland Water Bureau, Oregon
Cities of Reno and Sparks, Nevada
Trinity River Authority, Texas
Metropolitan Washington Council of Governments, District of Columbia
Colorado State University
University of Massachusetts
University of Nebraska
(Note: See also the NAWQA publications page, which lists more NAWQA publications, some of which are available on-line.)
Anderholm, S.K., Radell, M.J., and Richey, S.F., 1994, Water-quality assessment of the Rio Grande Valley study unit, Colorado, New Mexico, and Texas--Analysis of selected nutrient, suspended sediment, and pesticide data: U.S. Geological Survey Water-Resources Investigations Report 94-4061, 203 p.
Berndt, M.P., 1995, Ground-water quality assessment of the Georgia-Florida coastal plain study unit--Analysis of available information on nutrients: U.S. Geological Survey Water-Resources Investigations Report 95-4039, 39 p.
Blomquist, J.D., Fisher, G.T., Denis, J.M., Brakebill, J.W., and Werkheiser, W.H., 1996, Water-quality assessment of the Potomac River Basin--Basin description and analysis of available nutrient data, 1970-90: U.S. Geological Survey Water-Resources Investigations Report 95-4221.
Bonn, B.A., Hinkle, S.R., Wentz, D.A., and Uhrich, M.A., 1995, Analysis of nutrient and ancillary water-quality data for surface and ground water of the Willamette Basin, Oregon, 1980-90: U.S. Geological Survey Water-Resources Investigations Report 95-4036, 88 p.
Clark, G.M., 1994, Assessment of selected constituents in surface water of the upper Snake River Basin, Idaho and western Wyoming, water years 1975-89: U.S. Geological Survey Water-Resources Investigations Report 93-4229, 49 p.
Davis, J.V., Petersen, J.C., Adamski, J.C., and Freiwald, D.A., 1995, Water-quality assessment of the Ozark Plateaus study unit, Arkansas, Kansas, Missouri, and Oklahoma--Analysis of information on nutrients, suspended sediment, and suspended solids for 1970-92: U.S. Geological Survey Water-Resources Investigations Report 95-4042, 112 p.
Dennehy, K.F., Litke, D.W., McMahon, P.B., Tate, C.M., and Heiny, J.S., 1994, Water-quality assessment of the South Platte River Basin, Colorado, Nebraska, and Wyoming--Analysis of available nutrient, suspended-sediment, and pesticide data, water years 1980-92: U.S. Geological Survey Water-Resources Investigations Report 94-4095, 145 p.
Greene, K.E., Ebbert, J.C., and Munn, M.D., 1994, Nutrients, suspended sediment, and pesticides in streams and irrigation systems in the Central Columbia Plateau in Washington and Idaho, 1959-1991: U.S. Geological Survey Water-Resources Investigations Report 94-4215, 64 p.
Hamilton, P.A., and Shedlock, R.J., 1992, Are fertilizers and pesticides in the ground water?: U.S. Geological Survey Circular 1080, 16 p.
Harned, D.A., McMahon, Gerard, Spruill, T.B., and Woodside, M.D., 1995, Water-quality assessment of the Albemarle-Pamlico drainage basin, North Carolina and Virginia--Summary of water-quality data for suspended sediment, nutrients, and pesticides: U.S. Geological Survey Open-File Report 95-191, 131 p.
Helgesen, J.O., Zelt, R.B., and Stamer, J.K., 1994, Nitrogen and phosphorus in water as related to environmental setting in Nebraska: Water Resources Bulletin, v. 30, no. 5, p. 809-822.
Jones, J.L., and Wagner, R.J., 1995, Water-quality assessment of the Central Columbia Plateau in Washington and Idaho--Analysis of available nutrient and pesticide data for ground water, 1942-1992: U.S. Geological Survey Water-Resources Investigations Report 94-4258, 119 p.
Rupert, M.G., 1994, Assessment of nutrients and organic compounds in ground water in the upper Snake River Basin, Idaho and western Wyoming--Analysis of available data, 1980-91: U.S. Geological Survey Water-Resources Investigations Report 94-4135, 40 p.
Tornes, L.H., and Brigham, M.E., 1994, Nutrients, suspended sediment, and pesticides in waters of the Red River of the North basin, Minnesota, North Dakota, and South Dakota, 1970-90: U.S. Geological Survey Water-Resources Investigations Report 93-4231, 62 p.
Van Metre, P.C., and Reutter, D.C., 1994, Water-quality assessment of the Trinity River Basin, Texas--Analysis of available information on nutrients and suspended sediments, 1974-91: U.S. Geological Survey Water-Resources Investigations Report 94-4086, 72 p.
Wangsness, D.J., Frick, E.A., Buell, G.R., and DeVivo, J.C., 1994, Effect of the restricted use of phosphate detergent and upgraded wastewater-treatment facilities on water quality in the Chattahoochee River near Atlanta, Georgia: U.S. Geological Survey Open-File Report 94-99, 4 p.