![]()
Nitrate concentrations in ground water were analyzed by grouping samples from all ground-water surveys and special studies into three land-use categories: agriculture, forest, and urban. Most samples were from shallow monitoring wells or domestic wells in the surficial aquifer. The median nitrate concentration in ground water for wells in agricultural areas was 4.2 mg/L. Many of these samples were from the row-crop agricultural area in south-central Georgia, but some samples were from a ground-water seepage study in a citrus-grove area
(p. 22). In the row-crop agricultural study area, nitrate concentrations in 33 percent of samples were greater than the drinking-water standard.
To assess the effect of human activities on ground-water quality in the study area, samples were analyzed on the basis of four ranges of nitrate concentrations: less than or equal to 0.2 mg/L (natural background concentrations); 0.21 to 3.0 mg/L (concentrations may or may not represent human influence); 3.01 to 10 mg/L (elevated concentrations resulting from human activities); greater than 10 mg/L (exceeds drinking-water standard for nitrate as a result of human activities) (Madison and Brunett, 1985).
Samples with nitrate concentrations greater than the drinking-water standard of 10 mg/L were predominantly from agricultural areas.
In the Upper Floridan aquifer, the primary drinking-water aquifer for most of the study area, the median nitrate concentration was less than 0.05 mg/L in urban areas. In contrast, the median nitrate concentration was 0.95 mg/L in the surficial aquifer in urban areas. Nitrate concentrations in 60 percent of samples from Upper Floridan aquifer wells were less than 0.2 mg/L, whereas concentrations in 40 percent of samples from surficial wells were less than 0.2 mg/L. The highest concentration of nitrate in urban areas was 12 mg/L in a sample from a surficial well in Ocala, Fla. (Berndt and others, in press).
Nitrate concentrations commonly are highest in shallow wells due to sources of nitrogen at the land surface. Nitrate concentrations were higher in water from shallow wells in agricultural areas, but even samples from the most shallow wells in the urban areas had fairly low nitrate concentrations. The highest nitrate concentration (33 mg/L) was in a sample from a well located in a forest area with confined animal feedlots located nearby.
 (15,698 bytes)
Nitrate concentrations were generally higher in samples from agricultural areas and shallower wells.
Nitrogen isotope ratios were analyzed in ground-water samples from the row-crop agricultural study area (p. 22) to determine probable sources of nitrate. Nitrogen isotope ratios indicated that both inorganic fertilizer and animal wastes were the predominant sources of nitrate in ground water (Crandall, 1996).
Ground water in agricultural areas in most of the study area is at risk for elevated nitrate concentrations because of the relatively large amounts of fertilizer applications (Berndt and others, 1996), high mean annual recharge, sandy soils, and karst features. The central part of the study area is a karst region with well-drained sandy soils that have a low water-nutrient holding capacity; therefore, nitrogen not taken up by plants has a high probability of leaching to ground water. Nitrate was the nutrient detected most frequently in ground water.
To evaluate the effects of various factors such as soils, geology, topography, climate, and land use on nitrate concentrations in ground water, concentrations were compared by land resource provinces (Berndt and others, 1996). These provinces are shown on page 9. Nitrate concentrations in the surficial aquifer differed little among land resource provinces, but higher concentrations were generally measured in the Southern Coastal Plain. Surprisingly, nitrate concentrations were lowest in the Central Florida Ridge, despite the fact that most of the samples in this area were from the urban land-use study and the ground-water seepage study in a citrus-growing area.
High nitrate concentrations were more common in the Southern Coastal Plain, which contains most of the row-crop agriculture in the study area.
Other nitrogen and phosphorus compounds analyzed in ground water include ammonia, orthophosphate, and total phosphorus. Concentrations for these constituents were low and did not differ by land resource province or by land use. The highest concentration of ammonia as nitrogen was 0.81 mg/L in samples from surficial wells in urban and rangeland areas. Total phosphorus was less than 0.05 mg/L in about 50 percent of ground-water samples. The maximum phosphorus concentration, 1.3 mg/L, was measured in samples from surficial wells in urban and forest areas.
 (235,467 bytes)
Among streams that were sampled intensively (p. 22), the highest nitrate concentration was 2.5 mg/L in the Withlacoochee River in southwestern Georgia (Ham, 1997). This concentration is one-fourth of the USEPA 10-mg/L drinking-water standard. Nitrate concentrations in 95 percent of all stream samples were less than 1 mg/L; the median was 0.14 mg/L. Nitrogen concentrations greater than 1 mg/L could promote algal blooms in estuaries--areas where streams drain into coastal waters (National Oceanic and Atmospheric Administration/U.S. Environmental Protection Agency Team on Near Coastal Waters, 1988). Sources of nitrate include fertilizer, human and animal wastes, and atmospheric deposition (Asbury and Oaksford, 1997).
Although there are no aquatic criteria for dissolved phosphorus, the USEPA (1986) recommended a maximum concentration of total phosphorus equal to 0.1 mg/L to dis-courage excessive growth of aquatic plants. Dissolved phosphorus concentrations in 28 percent of the samples were greater than 0.1 mg/L. The highest dissolved phosphorus concentration among intensively sampled streams was 0.78 mg/L in the Withlacoochee River. The median concentration for intensively sampled streams was 0.04 mg/L.
Sources of nutrients are commonly associated with specific land uses, such as the use of fertilizer in agriculture. However, no direct relation was found when nutrient concentrations were compared to land-use percentages because land use tends to be a patchwork. For example, nitrate concentrations did not increase as the percentage of agricultural land in basins increased.
The lack of a direct relation between nitrate and phosphorus concentrations and land-use percentage could be caused partly by the intermingling of land uses within basins. Agricultural land in south-central Georgia commonly is located in upland areas and is interspersed among forests and wetlands that tend to occupy lowland areas. Small towns are scattered throughout the landscape. This pattern is less distinct in Florida. As a consequence of the intermingled land uses, basins with one dominant land use are generally small--less than about 50 mi2.
To circumvent this problem, the effects of land use on nutrient concentrations were evaluated by assigning all stream basins to one of four empirical categories based on land-use percentages. Comparisons were then made among the categories listed in the table on page 8.
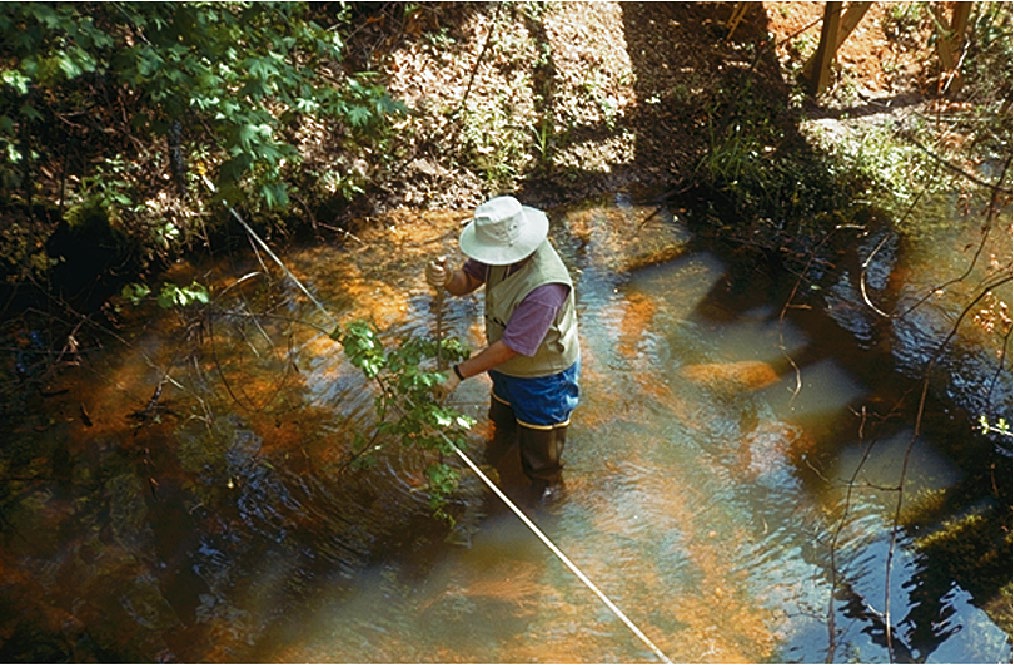
Most of the intensively sampled stream sites were located in south-central Georgia and north Florida. An additional 36 stream sites, called synoptic sites, were sampled twice to provide greater spatial coverage throughout the study area.
| Basin category | Land use | ||
|---|---|---|---|
| Agriculture | Forest-Wetland | Urban | |
| Agricultural | > 50% | Variable | < 10% |
| Urban | < 10% | Variable | > 10% |
| Forest-Wetland | < 10% | > 90% | < 10% |
| Mixed | All other sites | ||
Among the synoptic sites, the highest median nitrate concentration was 0.24 mg/L in streams draining basins in the mixed category, followed by 0.16 mg/L in streams draining agricultural basins. The relation between nitrate concentrations and basin categories was similar but less distinct for the intensively sampled sites. Median nitrate concentrations tended to be higher in the streams draining basins categorized as agricultural or mixed, whereas the medians tended to be lower for Lafayette Creek (urban basin) and Middle Prong (forest-wetland basin). Low nitrate concentrations in Lafayette Creek reflect the fact that the basin is a sewered suburban area with no wastewater discharges.
|
Nitrate and phosphorus concentrations in the stream draining a forest-wetland basin were generally lower than in other intensively sampled streams. |
Nitrate and phosphorus concentrations at synoptic sites differed among four basin land-use categories. |
Among the synoptic basins, the median dissolved phosphorus concentration was 0.08 mg/L for urban streams and 0.06 mg/L for agricultural streams. The highest median phosphorus concentration among the intensively sampled streams was in Bullfrog Creek, which drains an agricultural basin along the coast of west-central Florida. The high phosphorus concentrations at Bullfrog Creek may be partly derived from phosphate deposits in the area. The lowest median phosphorus concentrations were in Middle Prong (forest-wetland basin), in Tucsawhatchee Creek (agricultural basins), and in Turnpike Creek (mixed basin).
Increases in nitrate and phosphorus concentrations would be expected in the planting season when fertilizers are most frequently applied. Durations of the planting, harvesting, and fallow seasons were based on the growth of major crops in south-central Georgia. Minor crops, such as wheat, are grown in the fallow season. Concentrations did not consistently increase in the planting season for three intensively sampled streams that drain agricultural basins. Nitrate concentrations in the Little River tended to increase during high streamflow (Hatzell, 1997) as shown in February 1994 (see graph below). This increase could be related to the transport of nitrate downslope by subsurface flow from agricultural fields through wetlands to the Little River channel (Lowrance and others, 1985).
 (52,911 bytes)
Nitrate concentrations increased during periods of high flow in the Little River, a stream that drains an agricultural basin.
Land resource provinces represent various combinations of environmental factors--such as climate, geology, soils, and topography--expressed over large regions (Berndt and others, 1996). The highest median nitrate concentration and the lowest median phosphorus concentration were present in streams draining basins in the Southern Piedmont. These differences in median concentrations among the land resource provinces indicate that environmental factors could affect the nitrate and phosphorus concentrations in streams. Environmental factors also affect which land use is dominant in a province. For example, forest-wetland basins and urban basins tend to be located in the Coastal Flatwoods whereas agricultural basins tend to be located in the Southern Coastal Plain.
|
Nitrate concentrations at synoptic stream sites were highest in the Southern Piedmont, whereas phosphorus concentrations were highest in the Coastal Flatwoods. |
Sites were distributed among basins located in five land resource provinces. |