![]()
|
Nitrogen and phosphorus are essential plant nutrients. However, elevated concentrations of these nutrients can cause excessive growth of aquatic plants and can have detrimental effects upon desired uses of water. Contamination of water in the Study Unit by nutrients has been a concern of many agencies and the public for several years. Major sources of nitrogen and phosphorus in the Study Unit are poultry and cattle wastes, human wastes, and fertilizers. The U.S. Environmental Protection Agency (EPA) has established a maximum contaminant level (MCL) of 10 milligrams per liter (mg/L) for nitrate (as nitrogen) in drinking water (U.S. Environmental Protection Agency, 1988). Very high concentrations of nitrate (a compound of nitrogen and oxygen, and usually the most abundant form of nitrogen in water) can cause blue-baby syndrome in infants. Very few ground-water samples (less than 1 percent) and no surface-water samples in the Study Unit exceeded the MCL. In general, shallow wells (less than about 300 feet) or springs in agricultural areas are most likely to produce ground water with nitrate concentrations approaching or exceeding the nitrate MCL. Elevated nitrogen concentrations can result in several water-quality problems, such as algal blooms, oxygen depletion, and fishkills. The EPA has not made recommendations for nitrate concentrations that would limit detrimental effects on aquatic communities. The EPA has made recommendations for maximum ammonia concentrations to protect aquatic life. Ammonia concentrations generally are well below the recommended maximum in Ozark streams. The EPA recommends that total phosphorus should not exceed 0.1 mg/L in streams and that total phosphates (as phosphorus) should not exceed 0.05 mg/L in streams where they enter a lake or reservoir. Concentrations of total phosphorus and orthophosphate in streams in agricultural areas sometimes exceed these recommended concentrations. Elevated nitrate and phosphorus concentrations may be linked with differences between fish communities at sites in agricultural basins and sites in forested basins (see page 16). One of the major differences is a tendency for more algae-eating fish to inhabit the sites in agricultural basins. Fecal coliform bacteria live in the intestines of warm-blooded animals. The presence of these bacteria in water is indicative of contamination by fecal matter. Sources of these bacteria include animal manure, wastewater-treatment plants, and septic tanks. |
Poultry production is an extremely important industry in northwestern Arkansas, southwestern Missouri, and northeastern Oklahoma. Poultry litter can be a substantial source of nutrients and bacteria to water.
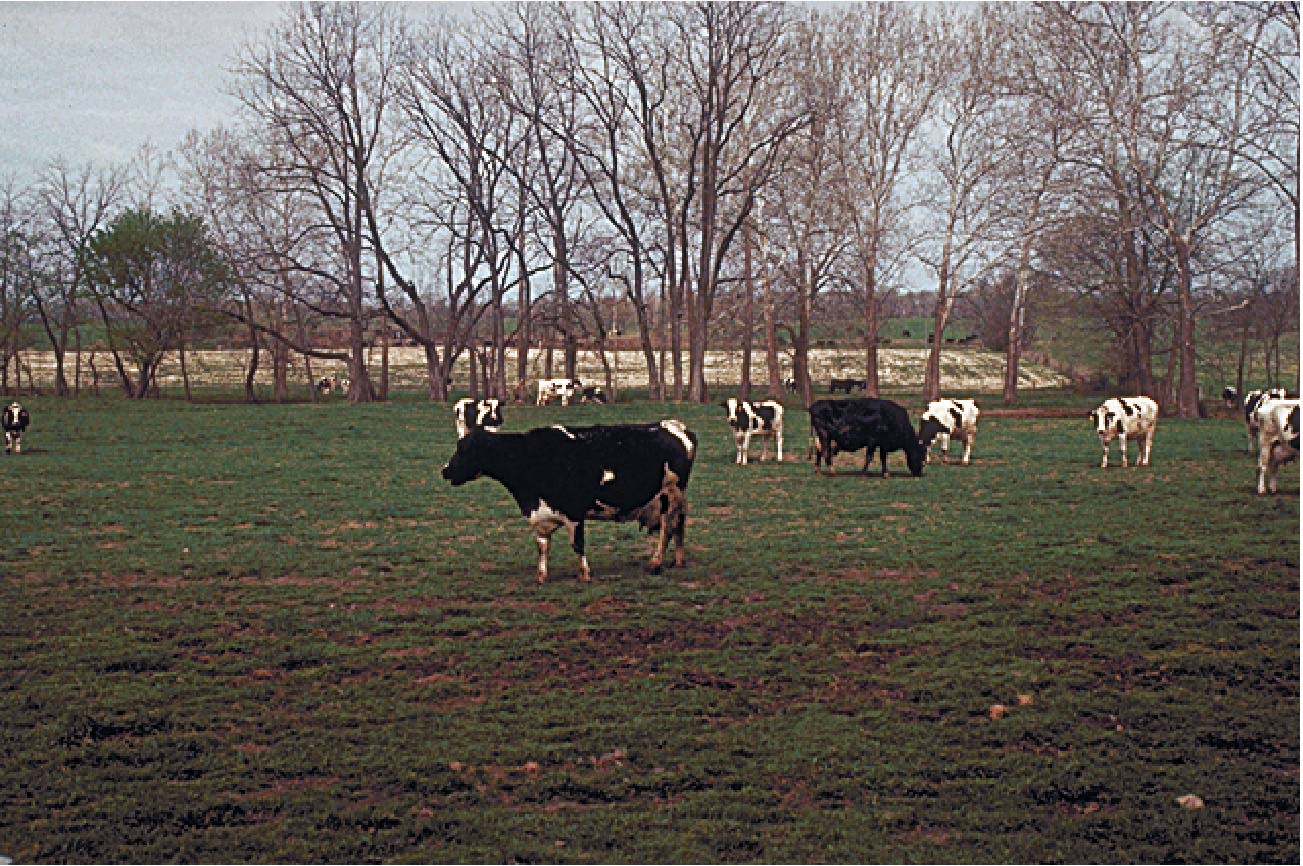
Beef and dairy cattle, which are important to the economy of the Ozarks, also are sources of nutrients and bacteria.
Forested areas protect water quality and are an
economic and recreational asset for the Ozarks.
|
NAWQA data collected in 1993-95 at stream sites chosen to represent selected combinations of land use, physiographic area, and basin size indicate land-use effects on nutrient concentrations. Median dissolved nitrate and total phosphorus concentrations are higher at sites representing agricultural (mostly poultry and cattle production) basins than at sites in forested basins. Nitrate concentrations generally increase as the percentage of agricultural land use increases. The range of nutrient concentrations at two sites with differing amounts and types of urban activities in their basins indicates that streams downstream from wastewater-treatment plants or urban areas may have nutrient concentrations that are substantially higher than concentrations in agricultural basins.
|
Nitrate concentrations in streams are lowest in streams draining forested areas. Phosphorus concentrations in streams also are lowest in streams draining forested areas. Samples collected 1993-95. |
Nitrate concentrations generally are higher in streams draining basins with greater percentages of agricultural land. Samples collected 1993-95. |
|
Recent historical data from 1980 to 1990 (Davis and others, 1995) also indicate that nutrient concentrations in streams in the Ozark Plateaus and the adjacent part of the Osage Plains generally were significantly greater in agricultural basins or downstream from wastewater-treatemant plants than in forested basins. |
|
NAWQA data collected in 1993-95 from wells and springs in the Springfield Plateau and Ozark aquifers also indicate that land use affects nutrient concentrations (Adamski, 1997a; 1997b). Nitrate concentrations were strongly associated with the percentage of agricultural land near the wells or springs. Concentrations in samples from "relatively pristine" sites (nearby forest cover greater than 90 percent) almost always were less than 1 mg/L (as nitrogen). Concentrations increased as the percentage of agricultural land increased; concentrations at sites with greater than 75 percent agricultural land use generally were about 3 mg/L, but ranged from about 1 to 10 mg/L.
Median nutrient concentrations in ground water (wells and springs) sampled from 1970 to 1992 also were less in forested areas than in agricultural areas (Davis and others, 1995). The median nitrate concentration in ground water from urban settings was lower than in agricultural or forested areas. The wells in these urban settings commonly are drilled through thick layers of confining rock before reaching the more productive confined aquifer.
Nitrate concentrations generally are higher in wells and springs in areas with greater agricultural land use. Samples collected 1993-95.
Fecal coliform bacteria concentrations in NAWQA samples collected in 1993-95 generally are higher at stream sites representative of agricultural basins than at sites in forested basins. Data for other bacteria and discharge suggest that poultry and cattle are primary sources of the fecal coliform bacteria. Median concentrations ranged from about 10 to 20 colonies per 100 milliliters (col/100 mL) at forested sites and about 60 to 460 col/100 mL at agricultural sites.
State water-quality standards vary from State to State, by time of year, and with use of the water body. However, median fecal coliform bacteria concentrations at some sites in agricultural areas are greater than concentrations allowable by State regulatory agencies for public swimming areas or for primary contact. At most sites in agricultural areas, more than 25 percent of the samples contained concentrations of fecal coliform bacteria greater than 200 col/100 mL.
|
Concentrations of nutrients and bacteria in streams and springs are affected by discharge (Davis and others, 1995). Depending on the source and constituent, concentrations may increase or decrease with discharge. For example, nutrients and bacteria concentrations downstream from wastewater-treatment plants generally are lower during periods of higher discharge because of dilution. Concentrations of bacteria and nutrients in streams and springs may increase with increasing discharge in response to rainfall in areas where nonpoint sources are the major contributors. Median nitrate and phosphorus concentrations generally are higher in springs than in wells because water from springs generally follows shallower flow paths and thus is more susceptible to surface contamination (Davis and others, 1995; Adamski, 1997b). Median nitrate concentrations of NAWQA samples collected in 1993 were about 0.5 mg/L in Ozark aquifer springs and about 0.3 mg/L in Ozark aquifer wells. Median nitrate concentrations in Springfield Plateau aquifer springs and wells were about 2.6 and 1.0 mg/L, respectively. Median concentrations of total phosphorus also were higher in springs (about 0.02 mg/L) than in wells (less than 0.01 mg/L). Differences also were detected in median concentrations of total phosphorus and nitrate in different aquifers and in confined and unconfined parts of the same aquifer (Davis and others, 1995). Concentrations generally were higher in the Western Interior Plains confining system and the Springfield Plateau aquifer. Concentrations generally were higher in the unconfined parts of the Springfield Plateau and Ozark aquifers than in the confined parts of these two aquifers. These differences probably are the result of land-use differences and the presence or absence of a protective confining layer between the aquifer and the land surface. Karst features in the Springfield and Salem Plateaus result in substantial interaction between surface water and ground water. The quality of surface water or ground water commonly is affected by the quality of the other. |
Many Ozark streams gain or lose substantial amounts of their flow through interactions with ground water. All of the water in this stream is going underground in this pool. (Photograph by J. Van Brahana, U.S. Geological Survey.)
Springs are abundant in much of the Ozarks and are vulnerable to contamination. (Permission granted by the Missouri Division of Tourism.) |
|
Nitrate (shown here) and phosphorus concentrations are higher in springs than in well water. Samples collected 1993. |
Nitrate (shown here) and phosphorus concentrations are higher in parts of aquifers near the land surface (unconfined) than in parts of aquifers that are deeper (and protected by an overlying confining layer). Samples collected 1970-92. |