![]()
Land use in the Central Nebraska Basins Study Unit is primarily agricultural--typically, large areas are rangeland, mixed rangeland and cropland, or cropland. Rangeland characterizes most of the western part of the basin whereas cropland is more typical in the eastern part [1]. Irrigated corn dominates the land use in the central Platte Valley subunit, where extensive applications of nitrate fertilizers and irrigation water are made each year to sustain crop yields. Nitrate concentrations in water at different locations reflect the differences in agricultural land management within the Study Unit.
|
|
Corn production dominates the land use in the Platte Valley and Glaciated Area subunits. | ||||||||||||||||||||||||
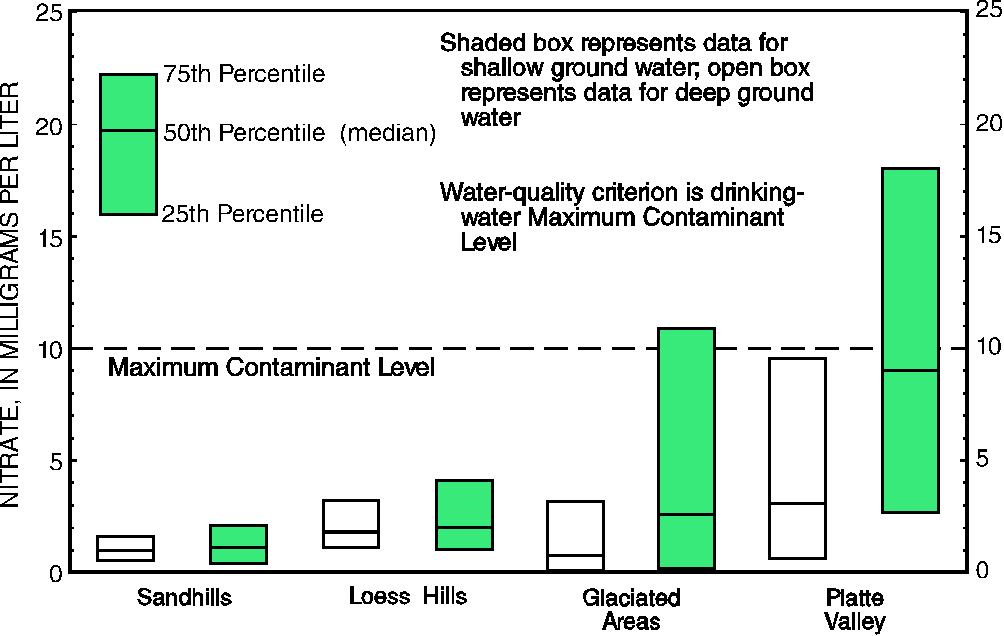
The Platte Valley subunit includes extensive areas of irrigated corn, permeable soils, and shallow ground water--all characteristics that increase the vulnerability of ground water to agricultural contaminants. The Glaciated Area subunit also has extensive areas of corn and other row crops. Consequently, concentrations of nitrate in shallow ground water are substantially larger in the Platte Valley and the Glaciated Area than in the Sandhills subunit, which is mostly rangeland, and the Loess Hills area, which is predominantly rangeland mixed with cropland. As the graph indicates, 45 percent of the shallow wells sampled in the Platte Valley and more than 25 percent of the shallow wells in the Glaciated Area exceeded the USEPA's MCL [3] of 10 milligrams per liter (mg/L) for nitrate in drinking water. In contrast, 75 percent of the shallow wells sampled in the Sandhills contained less than 2 mg/L of nitrate, and 75 percent of the shallow wells in the Loess Hills contained less than 5 mg/L. Nitrate concentrations in the deeper wells in the Platte Valley and the Glaciated Area were significantly smaller than in the shallow wells. Median nitrate concentrations in samples from the deep wells were similar (2 to 4 mg/L) among subunits. Nitrate concentrations in streams generally were substantially smaller than those from shallow ground water of the same subunits [4].
Nitrate concentrations were largest in the shallow ground water in areas of intense corn production.
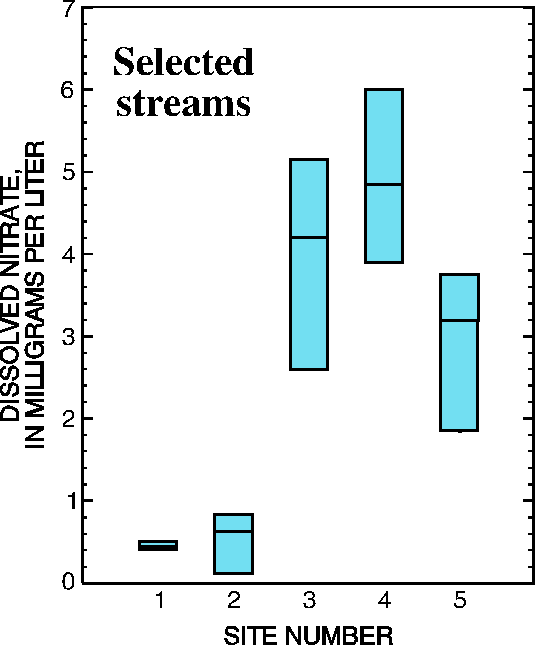
Annual applications of up to 150-200 pounds of nitrogen per acre are made to achieve large corn yields. Streams draining areas where corn production is extensive and fertilizer is applied every year at rates that sustain high-yielding corn (sampling sites 3, 4, and 5) tended to have larger nitrate concentrations than areas like sites 1 and 2. Nitrate concentrations in streams vary seasonally; larger concentrations of nitrate were detected during winter when aquatic plant growth was minimal, whereas smaller concentrations of nitrate were detected during summer when aquatic plant growth was greatest [5].
Nitrate concentrations were larger in streams in areas of intense crop production.
Irrigated cropland can affect nitrate concentrations in ground water. The Central Nebraska Basins Study Unit team examined data from Druliner and others [6] for selected wells in three areas (G1, G2, and G3, which extend beyond the Study Unit) that represent contrasting amounts of irrigated cropland ranging from 13 percent to about 50 percent. Median nitrate concentrations in areas with shallow depths to ground water and underlying intensely irrigated cropland that is dominated by corn production, like area G1 in the table, were more than twice the MCL of 10 mg/L for drinking water. The area G2 is similar to area G1 in the total percentage of land irrigated, but with generally larger depths to ground-water level and a median nitrate concentration that is one-fourth that of area G1. In both the G1 and G2 areas, more than 60 percent of the cropland is planted in corn. In these areas, median nitrate concentrations approached or exceeded the MCL. In comparison, area G3 had 35 percent of the cropland planted to corn, only 13 percent of the total land area irrigated, and relatively shallow depth to ground water, yet had a median nitrate concentration of 6.4 mg/L.
The Central Platte Natural Resources District (CPNRD) has established fertilizer-management areas in part of the central Platte Valley based on corn acreages and nitrate concentrations in ground water, similar to area G1. This area has concentrations of nitrate in ground water up to 40 mg/L. The CPNRD has imposed stringent guidelines on the timing and application rate of fertilizer in this area. In addition, the amount of fertilizer applied must be decreased by the amount of nitrate contained in the irrigation water that is applied. Moderate guidelines on fertilizer application are enforced in areas that are less vulnerable to contamination. A third area with the smallest percentage of cropland has minimal guidelines. This management strategy began during 1986-88.
The Study Unit team analyzed CPNRD data collected from 1974 through 1994 from selected irrigation and domestic wells [7]. Median nitrate concentrations, in areas that were assigned the most stringent guidelines, increased from about 8 mg/L in 1974 to about 18 mg/L in 1986. After implementation of the fertilizer-management strategy, the median nitrate concentrations in domestic wells decreased from 18 mg/L in 1986 to less than 2 mg/L in 1994.
|
Most stringent guidelines |
Moderate guidelines |
Minimal guidelines |
Since 1986, median nitrate concentrations from domestic wells have decreased where the most stringent fertilizer-management guidelines have been followed.
However, despite the most stringent guidelines, nitrate concentrations in nearly 25 percent of the wells in the area continued to exceed 20 mg/L in 1994. Therefore, it is possible that some areas where the most stringent guidelines apply have not been as responsive to the management strategy as others. Nitrate concentrations for different years, under moderate guidelines, did not differ significantly. Median nitrate concentrations in water samples from the domestic wells in the minimal management areas showed little change.