
Four major water-quality characteristics were evaluated for ground-water studies in each NAWQA Study Unit. Ground-water resources were divided into two categories: (1) drinking-water aquifers, and (2) shallow ground water underlying agricultural or urban areas. Summary scores were computed for each characteristic for all aquifers and shallow ground-water areas that have adequate data. Scores for each aquifer and shallow ground-water area in the Trinity River Basin were compared with scores for all aquifers and shallow ground-water areas sampled in the 20 NAWQA Study Units during
1992-95. Results are summarized by percentiles; higher percentiles generally indicate poorer quality compared with other NAWQA ground-water studies. Water-quality conditions for each drinking-water aquifer also are compared to established drinking-water standards and criteria for protection of human health. (Methods used to compute rankings and evaluate standards and criteria are described in Gilliom and others, in press.)
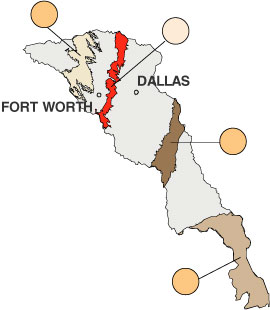
EXPLANATION
| Drinking-water aquifers |
| Shallow ground-water area |
| Ranking relative to national conditions—Darker colored circles generally indicate poorer quality. Bold outline of circle indicates one or more drinking-water standards or criteria are exceeded |
|
|
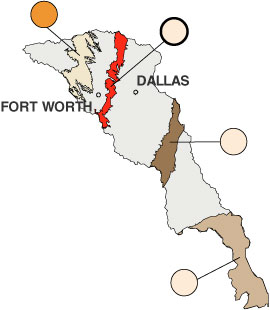
The median nitrate nitrogen concentrations are less than the median of comparable aquifers in NAWQA Study Units nationwide except for the Trinity aquifer, which has a median only slightly greater than the national median. The only sample that exceeded the drinking-water standard was from a shallow monitoring well in the Woodbine aquifer in an urban area. This part of the aquifer is not used for drinking-water supply.
DISSOLVED SOLIDS
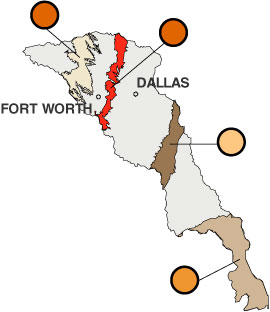
The median dissolved solids concentration of the Carrizo-Wilcox aquifer was slightly less than the median concentration of comparable aquifers in NAWQA Study Units nationwide. However, the medians of the Gulf Coast, Trinity, and Woodbine aquifers were greater than the national median. The percentage of wells with samples that exceeded the SMCL ranges from 17 percent in the Carrizo-Wilcox aquifer to 71 percent in the Woodbine aquifer.
VOLATILE ORGANIC COMPOUNDS
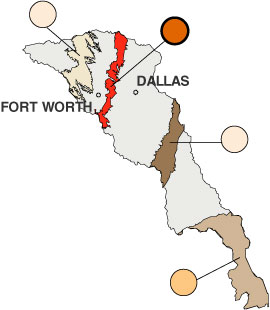
One or more VOCs were detected in less than 5 percent of the wells in the Trinity, Carrizo-Wilcox, and Gulf Coast aquifers. The percentage of detections in all three aquifers is less than the median percentage of detections for all comparable aquifers in NAWQA Study Units nationwide. These results are in contrast to a detection rate of 18 percent for the network of shallow wells in the Woodbine aquifer in an urban area. This detection rate is in the worst category for all comparable aquifers. Only one well in the urban area had a VOC concentration that exceeded the drinking-water standards.
PESTICIDES
The percentages of pesticide detections in the Trinity, Carrizo-Wilcox, and Gulf Coast aquifers are less than the median of all NAWQA ground-water surveys nationwide. Although pesticides were detected in 29 percent of the wells sampled in the Woodbine aquifer, that percentage is in the lowest category relative to nationwide results for shallow ground water underlying urban and agricultural areas.
|
CONCLUSIONS No samples of ground water in aquifers used for drinking water exceeded EPA MCLs and HAs for nutrients, pesticides, and VOCs; however, dissolved solids concentrations commonly exceed the SMCL. Dissolved solids in all four aquifers, nitrate in the Trinity aquifer, and VOCs in the Woodbine aquifer were at greater concentrations or were detected more frequently than national medians for comparable aquifers. The avenues of contamination could be natural recharge or recharge along the outside of well casings that are not completely sealed at the surface. |
| AccessibilityFOIAPrivacyPolicies and Notices | |
 |
|