
Hydrologic Benchmark Network Stations in the Eastern U.S. 1963-95 (USGS Circular 1173-A)
| Abstract and Map Index | List of all HBN Stations | Introduction to Circular | Analytical Methods |
To download a printer friendly PDF version of this information click here.
This report details one of the approximately 50 stations in the Hydrologic Benchmark Network (HBN) described in the four-volume U.S. Geological Survey Circular 1173. The suggested citation for the information on this page is:
|
All of the tables and figures are numbered as they appear in each circular. Use the navigation bar above to view the abstract, introduction and methods for the entire circular, as well as a map and list of all of the HBN sites. Use the table of contents below to view the information on this particular station.
|
|
| 1. Site Characteristics and Land Use |
| 2. Historical Water Quality Data and Time-Series Trends |
| 3. Synoptic Water Quality Data |
| 4. References and Appendices |
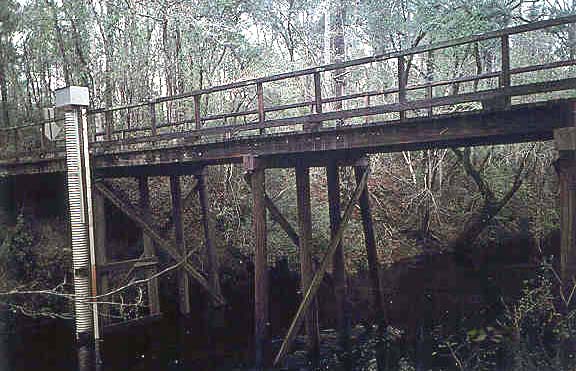
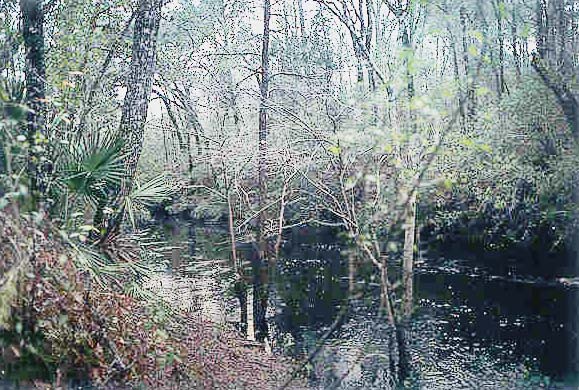
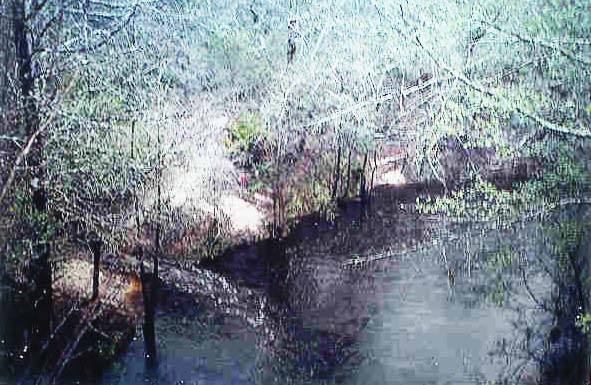
The Sopchoppy River HBN Basin is in the Apalachicola Coastal Lowlands section of the Coastal Plain physiographic province in the Panhandle of Florida (Figure 6. Map of the study area in the Sopchoppy River River Basin and photograph of the stream channel near the gage). The Sopchoppy River drains 265 km² of flat, sandy terrain with shallow, swamp-like areas and poorly defined drainages that range in elevation from 3.0 to 34 m. The USGS gaging station is 7.5 km north of Sopchoppy, Fla., at latitude 30°07'45'' and longitude 84°29'40''. The Sopchoppy River originates at the confluence of several small creeks in the northern part of the basin then flows south through a narrow, incised valley before reaching the gage. The channel length of the incised section is about 15 km and the stream gradient in this reach ranges from 0.6 to 0.8 m/km. The main channel is perennial, and discharge generally peaks twice annually, once in January and February when evapotranspiration rates are low and again in July and August when precipitation is heaviest. Mean monthly discharge ranges from 1.8 m³/s in November to 8.8 m³/s in February and 8.9 m³/s in August. Average annual runoff from the basin was 67 cm from 1964 through 1995 (U.S. Geological Survey, Water Resources Data, Florida). A distinguishing hydrologic characteristic of the river is its rapid response to precipitation events because of surface runoff from the large areas of the basin covered by wetlands (U.S. Department of Agriculture, 1995). Climate of the area is characterized by warm, humid summers and short, mild winters. Air temperatures are moderated by the Gulf of Mexico, and average monthly air temperatures range from 12.2°C in January to 27.4°C in July. Precipitation averages 145 cm annually and is heaviest from June through September when rain can fall as frequently as every other day (Allen, 1991).
 |
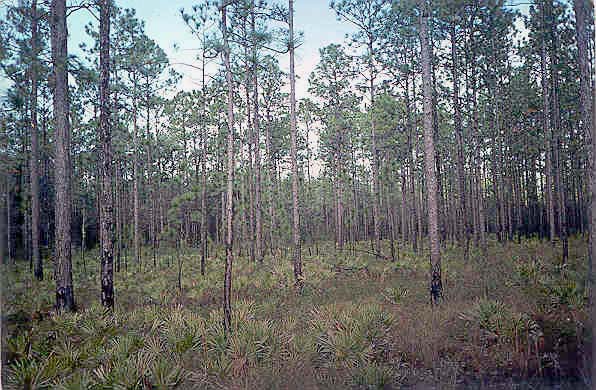
The basin lies in the Outer Coastal Plain Mixed Forest ecoregion (Bailey and others, 1994), and the dominant vegetation communities are pine-palmetto flatwood, titi swamp, and bay swamp (Clewell, 1981). The pine-palmetto flatwoods grow in flat, sandy areas were the ground is saturated to the surface only during periods of rain. The dominant species are slash pine and longleaf pine with a ground cover of wire grass and saw palmetto. The titi swamp community, which covers most of Bradwell Bay, is a tangle of shrubs and small trees including black titi, fetterbush, swamp Cyrillas, and little-leaf Cyrillas. The bay swamp community grows in swampy depressions scattered among the flatwoods. The dominant species is sweet bay with a ground cove of sphagnum moss. Soils in the basin are classified as Ultisols and are mapped in the Leon-Scranton- Rutlege and Croatan-Dorovan soil associations (Allen, 1991). The Leon-Scranton-Rutlege association includes soils developed in sandy marine sediments underlying broad flatwoods areas (Allen, 1991). These soils are composed almost entirely of sand, are very poorly drained, and have an organic-stained subsoil. In areas dominated by these soils, the water table is typically 25 to 100 cm below the land surface. The clay mineralogy is dominated by smectite, a 14Å intergrade mineral, and kaolinite. Soils belonging to the Croatan-Dorovan association are found in swamps and depressions, including the entire Bradwell Bay, where the water table is at or above the soil surface 5 to 8 months of the year (Allen, 1991). A typical soil profile has a surface layer of dark, well-decomposed organic matter overlying a subsoil of dark sand and clay.
The basin is underlain by flat-lying limestone of the Miocene St. Marks Formation, which crops out along the bed and bank of the Sopchoppy River in the southern one-half of the basin (Rupert and Spencer, 1988). The St. Marks Formation is described as a cream-colored, partly recrystallized limestone that is in places slightly dolomitic and stained with limonite (Cameron and others, 1977). The St. Marks Formation comprises the upper portion of the Floridan aquifer system that is the source of most domestic water in Wakulla County. In most areas of the basin, the limestones are covered by 6 to 9 m of unconsolidated marine sediments of Pleistocene and Holocene age. These surficial deposits are composed of quartz sand, silt, clay, muck, and peat and have been mapped in detail by Cameron and others (1977).
The Sopchoppy River Basin drains the western part of Wakulla County and is entirely in the boundaries of the Apalachicola National Forest. The Bradwell Bay Wilderness encompasses 89 km² of National Forest land on the west side of the river. Two small parcels of private land, totaling less than 500 ha, also lie in the National Forest boundary. Non wilderness areas of the basin are accessible by several forest roads; however, the poorly drained soils in the area may limit vehicle access during wet periods of the year. Access to the wilderness is limited to roads around the perimeter and foot trails in the interior. During all but the driest times of the year, the river is navigable by small boat downstream from the wilderness boundary. Boat travel upstream from the wilderness boundary is more difficult because of swampy and densely vegetated conditions along the river.
Land-use activities in the Apalachicola National Forest are related to timber harvest and prescribed burning, which are conducted primarily for the management of wildlife habitat rather than the commercial value of the timber (John Cameron Forest Service, written commun., 1996). Timber harvests are conducted on a 60-year rotation in small patches that average 20 ha in size. Swamps and lowlands along the river corridor are considered unsuitable for cutting, and logging is generally restricted to drier upland areas. The Apalachicola National Forest is currently in the process of revising its Land and Resource Management Plan (John Cameron, written commun., 1996). Under the revised plan, the rotation lengths for timber harvesting will increase to 120 years for longleaf pine and 100 years for slash pine. Prescribed burning is conducted on 3-year cycles to maintain a fire climax forest system. The basin is in an area that has frequent lightning strikes; as a consequence, many species of plants and animals have adapted to fire as the primary force driving forest succession. The most substantial change in land use that has occurred since the establishment of the HBN station was the creation of the Bradwell Bay Wilderness in 1975, one of the first wilderness areas established in the Eastern United States. All segments of the river corridor in the HBN basin have been recommended by the Forest Service for inclusion in the National Wild and Scenic River System, but designation is still pending.
 |
The HBN data set analyzed for this report includes 252 water-quality samples that were collected from April 1964 through August 1995. Sampling frequency progressively increased from 2 samplings in 1965 to 10 in 1968. Sampling frequency was monthly from 1969 through 1982 and quarterly from 1983 through 1995. Although not documented, water-quality samples in the early part of the record probably were analyzed at a USGS laboratory in Ocala, Fla. (Durum, 1978). After establishment of the Central Laboratory System, samples were analyzed at the Central Laboratory in Atlanta, Ga., from 1973 through 1985 and at the NWQL in Arvada, Colo., from 1986 through 1995. Daily discharge records for the Sopchoppy River (station 02327100) are available beginning in June 1964. The gage was operated as a crest stage station from 1961 through 1964. Records of daily water temperature at the gage are available from June 1964 through September 1979. Daily water-level measurements are available for a ground-water well located 200 m east of the gage (station 300740084293001) from January 1967 through September 1986. Daily precipitation amount has been measured at two locations-the gage and Otter Camp (station 301830084370001) since February 1966.
Calculated ion balances for 230 samples with complete major ion analyses are shown in Figures 7a and 7b. Temporal variation of discharge, field pH, major ion concentrations, and ion balance at Sopchoppy River, Florida. Ion balances ranged from -54 to +46 percent, and only 55 percent of the samples had calculated values within the ±10 percent range. This wide range of values reflects the difficulty in making precise analytical measurements at the low solute concentrations typical of this station. The mean charge balance of all samples was 6.8 percent, indicating that the samples had an excess of measured cations over anions. Because the Sopchoppy River is considered a black-water river, deriving the tealike color of its water from dissolved organic matter, the observed anion deficit can be explained by the presence of unmeasured organic anions.
[Concentrations in units of microequivalents per liter, discharge in cubic meters per second, specific conductance in microsiemens per centimeter at 25 degrees Celsius, and silica in micromoles per liter; n, number of stream samples; VWM, volume-weighted mean; inst., instantaneous; spec. cond., specific conductance; <, less than; --, not reported]
| Parameter | Stream Water | Precipitation VWMa | |||||
| Minimum | First quartile | Median | Third quartile | Maximum | n | ||
| Discharge, inst. | 0.03 | 0.37 | 1.9 | 5.1 | 99 | 249 | -- |
| Spec. cond., field | 19 | 38 | 46 | 70 | 290 | 249 | -- |
| pH, field | 3.2 | 4.2 | 4.9 | 6.6 | 8.3 | 248 | 4.8b |
| Calcium | 5 | 80 | 180 | 550 | 2,550 | 249 | 3.5 |
| Magnesium | <8.0 | 25 | 48 | 110 | 420 | 247 | 2.8 |
| Sodium | 39 | 74 | 87 | 100 | 220 | 246 | 11 |
| Potassium | <2.6 | 2.6 | 2.6 | 5.1 | 18 | 245 | .7 |
| Ammonium | <14 | 34 | 43 | 54 | 239 | 111 | 5.0 |
| Alkalinity, laboratory | <20 | <20 | 40 | 440 | 2,940 | 247 | -- |
| Sulfate | <21 | 21 | 83 | 150 | 580 | 249 | 20 |
| Chloride | 54 | 110 | 130 | 140 | 280 | 248 | 12 |
| Nitrite plus nitrate | <.7 | <3.6 | <7.1 | 7.1 | 21 | 84 | 9.2c |
| Silica | 15 | 63 | 81 | 100 | 180 | 248 | -- |
a Data are volume-weighted mean concentrations for 1984-94.
b Laboratory pH.
c Nitrate only.
Time-series plots of the major dissolved constituents were inspected for evidence of method-related effects (fig. 7). Several patterns are evident in the sulfate records. The unusually high sulfate concentrations reported in the 1980's are coincident with the use of a turbidimetric titration for sulfate analyses at the NWQL between March 1986 and December 1989 (Fishman and others, 1994). In 1989, the NWQL determined that sulfate concentrations can be over-estimated by this technique and changed the method to ion chromatography in 1990 (Office of Water Quality Technical Memorandum No. 90.04, Turbidimetric Sulfate Method, issued December 21, 1989, at URL http://water.usgs.gov/admin/memo/). The bias was most pronounced in dilute waters, although it was not consistent among samples and appeared to be influenced by factors such as color and turbidity (Schertz and others, 1994). Assuming ion chromatography produced unbiased sulfate concentrations, these results indicate that analytical methods used prior to 1967 and between 1973 and 1983 also may have introduced a positive bias. As with the turbidimetric technique, these earlier methods may have been susceptible to color interferences caused by the high organic content of stream water at this station.
Median concentrations and ranges of major dissolved constituents in stream water collected at the HBN gaging station and VWM concentrations in precipitation measured at the Quincy NADP site about 25 km north of the basin are presented in table 10. Precipitation chemistry at the NADP station is dilute and slightly acidic with a VWM pH of 4.8 during the 11 years of record. The dominant cations in precipitation were hydrogen, which contributed 41 percent of the total cation charge, and sodium and ammonium, which contributed 28 and 13 percent, respectively. Sulfate was the dominant anion, accounting for 49 percent of the anion charge, and chloride and nitrate accounted for 29 and 22 percent, respectively. These results indicate that precipitation at the nearby NADP station probably is a mixture of both strong acids derived from anthropogenic emissions of sulfur and nitrogen compounds and salt derived from marine aerosols (Fu and Winchester, 1994).
 |
Stream water in the Sopchoppy River has a bimodal chemical composition that is strongly related to stream discharge. For example, at flows below 0.28 m³/s (25 percent of samples), the average specific conductance is 180 mS/cm, but for flows above 0.28 m³/s, the average specific conductance drops to only 45 mS/cm. A similar bimodal pattern also is observed for pH, calcium, magnesium, and alkalinity as shown in figure 7. The predominance of calcium, magnesium, and alkalinity at flows below 0.28 m³/ s indicates that ground water from limestones of the underlying St. Marks Formation is the dominant source of streamflow under base-flow conditions. In contrast, hydrogen, sodium, chloride, and sulfate are typically the dominant ions at higher flows. Under these hydrologic conditions, the chemistry of stream water is more similar to the composition of precipitation, which reflects surface runoff from large wetland areas in the basin. The median chloride concentration in stream water was 130 meq/L, which is nine times larger than the VWM concentration of 12 meq/L in wet precipitation. On the basis of the difference between average annual runoff and precipitation, evapotranspiration can account for about a twofold increase in the chloride concentration of precipitation, indicating that a considerable amount of stream-water chloride is derived from sources other than wet deposition. Considering the proximity of this site to the Gulf of Mexico, it seems likely that a substantial amount of stream-water chloride (and sodium) is derived from dry deposition of marine aerosols (Pollman and Canfield, 1991). The median concentration of sulfate in stream water was 83 meq/L, which probably is somewhat overestimated because of analytical artifacts discussed previously. Assuming that sulfate concentrations measured by ion chromatography are unbiased, the median sulfate concentration at this station may be closer to 30 meq/L. This concentration is only slightly larger than the VWM concentration of 20 meq/L in precipitation and may indicate that some of the atmospherically deposited sulfate is retained in the basin. Possible mechanisms of sulfate retention include adsorption on basin soils or sulfate reduction in the extensive wetland areas of the basin.
The solute composition of stream water was further evaluated by analyzing correlations between solutes and stream discharge (table 11). The weathering-derived constituents calcium, magnesium, alkalinity, and silica were strongly correlated with discharge (0.844 > r > 0.968). These strong associations with flow are consistent with the idea that base flow from the underlying St. Marks Formation is diluted with surface runoff from wetland areas during periods of high flow. Among the solutes, the strongest correlations were found between calcium and magnesium (rho = 0.967) and calcium and alkalinity (rho = 0.915), and the weakest correlations were found between sulfate and chloride. Strong correlations between calcium, magnesium, and alkalinity are consistent with the weathering stoichiometry of calcite and dolomite in the bedrock. The poor correlations with chloride and sulfate are consistent with the idea that these two solutes are derived primarily from atmospheric sources.
[Q, discharge; Ca, calcium; Mg, magnesium; Na, sodium; K, potassium; Alk, alkalinity; SO4, sulfate; Cl, chloride; Si, silica]
| Q | pH | Ca | Mg | Na | K | Alk | SO4 | Cl | |
| pH | -0.904 | ||||||||
| Ca | -.967 | 0.917 | |||||||
| Mg | -.911 | .902 | 0.967 | ||||||
| Na | -.664 | .671 | .679 | 0.723 | |||||
| K | -.651 | .702 | .701 | .735 | 0.577 | ||||
| Alk | -.896 | .886 | .915 | .884 | .617 | 0.677 | |||
| SO4 | .359 | -.347 | -.314 | -.296 | -.271 | -.166 | -0.352 | ||
| Cl | -.045 | -.075 | -.031 | -.042 | .178 | -.178 | -.084 | 0.153 | |
| Si | -.845 | .844 | .876 | .885 | .707 | .553 | .770 | -.358 | 0.107 |
Results of the seasonal Kendall test for trends in discharge and major dissolved constituents from 1964 through 1995 are shown in table 12. The only statistically significant upward trend was observed in the unadjusted sulfate concentrations at the 0.01 confidence level. The LOWESS curve in figure 7 shows a pattern of increasing sulfate concentrations between 1970 and 1980, followed by a period of low concentrations in the 1990's. This pattern in stream-water sulfate is somewhat consistent with trends in sulfate deposition in the region since the 1960's. Estimates of sulfate deposition in the Southeast show a substantial increase in deposition between 1960 and 1980 (Husar and others, 1991). Between 1980 and 1992, substantial declines in sulfate concentrations were observed at many NADP stations in the Southeast (Lynch and others, 1995). Although trends in stream-water sulfate appear to mimic deposition trends, it is perhaps more likely that the pattern reflects changes in analytical methods during the period of record. As discussed previously, some analytical methods used prior to 1990 probably introduced a substantial positive bias, which greatly complicates the interpretation of sulfate trends at this station.
[Trends in units of microequivalents per liter per year, except discharge in cubic meters per second per year, pH in standard units per year, and silica in micromoles per liter per year; <, less than; --, not calculated]
| Parameter | Unadjusted | Flow adjusted | ||
| Trend | p-value | Trend | p-value | |
| Discharge | -0.01 | 0.641 | -- | -- |
| pH, field | <.1 | .902 | -0.1 | 0.741 |
| Calcium | .3 | .694 | .9 | .360 |
| Magnesium | <.1 | .705 | .2 | .552 |
| Sodium | <.1 | .898 | -.2 | .545 |
| Potassium | <.1a | .119 | -- | -- |
| Alkalinity, laboratory | -1.6 | .821 | -- | -- |
| Sulfate | 2.8a | .007 | -- | -- |
| Chloride | <.1 | .687 | <-.1 | .921 |
| Nitrite plus nitrate | (b) | -- | -- | -- |
| Silica | .4 | .278 | .5 | .049 |
aCalculated using a trend test for censored data.
bInsufficient data to calculate trend.
 |
Results of the surface-water synoptic sampling of January 11, 1991, are shown in table 13; locations of sampling sites in the basin are shown in figure 6. During the synoptic sampling, discharge at the gage was 6.51 m³/s compared to the median daily discharge of 7.6 m³/s for January (Lawrence, 1987), indicating that the basin was sampled during normal flow conditions for that time of year. Concentrations measured at the gage (site 1) during the synoptic sampling were generally within the first-quartile to third- quartile range measured at the gage during the entire period of record (table 10). The tributary and upstream sites were similar in composition to the stream at the gage. All samples are very dilute, with specific conductances below 83 mS/cm, and acidic, with pH values that ranged from 3.72 to 4.29. Organic acids probably are the main source of acidity in these waters, although some acidity may be derived from strong acid inputs in precipitation. The presence of organic acids in surface waters is supported by the observation that all samples had positive ion balances (18 to 40 percent). As discussed previously, this acidic condition in stream-water chemistry at the gage occurs during wetter periods of the year when streamflow is dominated by surface runoff from the wetlands. This hydrologic condition probably also is the reason that little spatial variability in surface-water chemistry was observed at the time of the synoptic sampling. A large component of surface runoff in streamflow would tend to mask any spatial variations in stream chemistry that might reflect basin characteristics, such as geology. A weak spatial pattern that does emerge from the chemical data is that stream chemistry of the headwater samples (sites 4, 5, and 6) tends to be more dilute and more acidic than the downstream samples (sites 1 and 3). This pattern may reflect a shift in the relative contributions of surface runoff and base flow with downstream position along the river. The one sampling site that does not appear to follow this general pattern is Monkey Creek (site 2), a small tributary that drains the large wetland of Bradwell Bay. This site has a low pH and calcium concentration like the headwater sites, but has sulfate, sodium, and silica concentrations similar to the downstream sites.
[Site locations shown in fig. 6; Q, discharge in cubic meters per second; SC, specific conductance in microsiemens per centimeter at 25 degrees Celsius; pH in standard units; Ca, calcium; Mg, magnesium; Na, sodium; K, potassium; Alk, alkalinity; SO4, sulfate; Cl, chloride; NO3, nitrate; concentrations in microequivalents; Si, silica in micromoles per liter; <, less than; --, not measured]
| Site | Station number | Q | SC | pH | Ca | Mg | Na | K | Alk | SO4 | Cl | NO3 | Si | Criteriaa | Remarks |
| 1 | 02327100 | 6.51 | 51 | 4.29 | 170 | 62 | 100 | 3.3 | <10 | 96 | 100 | <0.5 | 90 |
|
|
| 2 | 300930084312200 | -- | 83 | 3.72 | 48 | 49 | 100 | 4.6 | <10 | 180 | 96 | <.5 | 100 | MT, LU | Downstream from wilderness |
| 3 | 301012084295400 | -- | 67 | 3.95 | 110 | 54 | 110 | 3.3 | <10 | 140 | 130 | <.5 | 110 | MT | Downstream from wilderness |
| 4 | 301353084321900 | -- | 57 | 3.94 | 55 | 38 | 100 | 4.6 | <10 | 79 | 100 | <.5 | 90 | MT | Upstream from wilderness |
| 5 | 301518084352300 | -- | 65 | 3.81 | 70 | 38 | 96 | 4.1 | <10 | 71 | 96 | <.5 | 92 | MT, LU | Some logging |
| 6 | 301521084355300 | -- | 51 | 3.88 | 18 | 25 | 78 | 3.6 | <10 | 31 | 79 | <.5 | 83 | MT, LU | Some logging |
aCriteria used in selection of sampling sites: MT = major tributary, LU = land use.
Allen, W.J., 1991, Soil survey of Wakulla County, Florida: U.S. Department of Agriculture Soil Conservation Service, p. 163.
Bailey, R.G., Avers, P.E., King, T., and McNab, W.H., eds., 1994, Ecoregions and subregions of the United States with supplementary table of map unit descriptions: Washington, D.C., U.S. Department of Agriculture Forest Service, scale 1:7,500,000 (also at URL http://www.fs.fed.us/land/ecosysmgmt/ecoreg1_home.html).
Cameron, C.C., and Mory, P.C., 1977, Mineral resources of the Bradwell Bay Wilderness and the Sopchoppy River Study Area, Wakulla County, Florida: U.S. Geological Survey Bulletin 1431, 37 p.
Clewell, A.F., 1981, Natural setting and vegetation on the Florida panhandle: Mobile, Ala., U.S. Army Corps of Engineers, Miscellaneous Report, Contract DACWO1-77-C-0104, 773 p.
Durum, W.H., 1978, Historical profile of quality of water laboratories and activities, 1879-1973: U.S. Geological Survey Open-File Report 78-432, 235 p.
Fishman, M.J., Raese, J.W., Gerlitz, C.N., and Husband, R.A., 1994, U.S. Geological Survey approved inorganic and organic methods for the analysis of water and fluvial sediment, 1954-94: U.S. Geological Survey Open-File Report 94-351, 55 p.
Fu, J.M., and Winchester, J.W., 1994, Sources of nitrogen in three watersheds of northern Florida, USA—Mainly atmospheric deposition: Geochimica et Cosmochimica Acta, v. 58, no. 6, p. 1581-1590.
Husar, R.B., Sullivan, T.J., and Charles, D.F., 1991, Historical trends in atmospheric sulfur deposition and methods for assessing long-term trends in surface water chemistry, in Charles, D.F., ed., Acidic deposition and aquatic ecosystems-Regional case studies: New York, Springer-Verlag, p. 48-92.
Lawrence, C.L., 1987, Streamflow characteristics at hydrologic benchmark stations: U.S. Geological Survey Circular 941, 123 p.
Lynch, J.A., Grimm, J.W., and Bowersox, V.C., 1995, Trends in precipitation chemistry in the United States-A national perspective, 1980-1992: Atmospheric Environment, v. 29, no. 11, p. 1231-1246.
Pollman, C.D., and Canfield, D.E., Jr., 1991, Florida, in Charles, D.F., ed., Acidic deposition and aquatic ecosystems-Regional case studies: New York, Springer-Verlag, p. 367-416.
Rupert, Frank, and Spencer, Steve, 1988, Geology of Wakulla County, Florida: Florida Geological Survey Bulletin 60, 46 p.
Schertz, T.L., Wells, F.C., and Ohe, D.J., 1994, Sources of trends in water-quality data for selected streams in Texas, 1975-89 water years: U.S. Geological Survey Water-Resources Investigation 94-4213, 49 p.
U.S. Department of Agriculture, 1995, Final environmental impact statement and wild and scenic river study report on the Sopchoppy River: Forest Service Southern Region, Florida.
U.S. Geological Survey, published annually, Water resources data, Florida, Tallahassee: U.S. Geological Survey Water Data Report.
a. U.S. Geological Survey topographic maps:
b. Geologic maps:
c. Soil surveys
d. Other maps
Table B-1. NWIS site identification numbers and site names for water-quality sampling sites.
| Site | Identification Number | Site Name |
| 1 | 02327100 | SOPCHOPPY RIVER NR SOPCHOPPY, FLORIDA |
| 2 | 300930084312200 | MONKEY CREEK |
| 3 | 301012084295400 | SOPCHOPPY RIVER AT S END WILDERNESS |
| 4 | 301353084321900 | SOPCHOPPY RIVER AT N END WILDERNESS |
| 5 | 301518084352300 | EAST BR SOPCHOPPY RIVER |
| 6 | 301521084355300 | WEST BR SOPCHOPPY RIVER |
| Back to 1173-A Contents |
This page maintained by Nichole Bisceglia.
Last updated July 17, 2000.