
Hydrologic Benchmark Network Stations in the Eastern U.S. 1963-95 (USGS Circular 1173-A)
| Abstract and Map Index | List of all HBN Stations | Introduction to Circular | Analytical Methods |
Tallulah River near Clayton, Georgia (Station 02178400)
To download a printer friendly PDF version of this information click here.
This report details one of the approximately 50 stations in the Hydrologic Benchmark Network (HBN) described in the four-volume U.S. Geological Survey Circular 1173. The suggested citation for the information on this page is:
|
All of the tables and figures are numbered as they appear in each circular. Use the navigation bar above to view the abstract, introduction and methods for the entire circular, as well as a map and list of all of the HBN sites. Use the table of contents below to view the information on this particular station.
|
|
| 1. Site Characteristics and Land Use |
| 2. Historical Water Quality Data and Time-Series Trends |
| 3. Synoptic Water Quality Data |
| 4. References and Appendices |
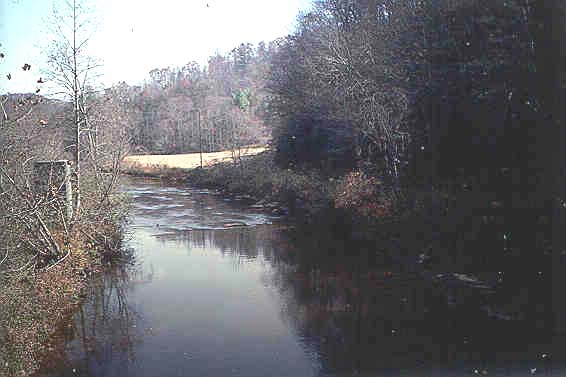
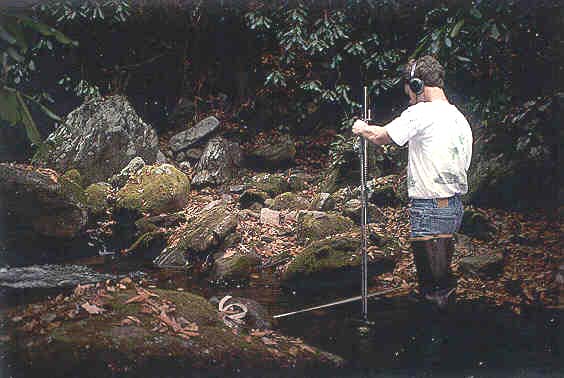
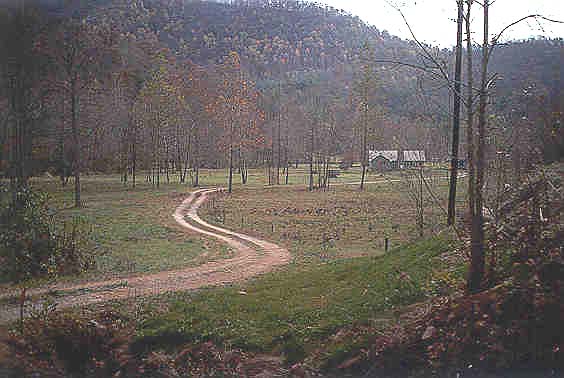
The Tallulah River HBN Basin is in the Blue Ridge physiographic province in the northeast corner of Georgia (Figure 10.Map of the study area in the Tallulah River Basin and photograph of the basin landscape near Tate City, Georgia). The basin drains 146 km² of steep, mountainous terrain that ranges in elevation from 573 m at the gage to 1,676 m at the summit of Standing Indian Mountain. The USGS gaging station is 17 km
 |
The basin lies in the Central Appalachian Broadleaf Forest ecoregion (Bailey and others, 1994). The four major vegetation communities in the area are distributed in a reasonably predictable pattern controlled by elevation and moisture (Day and others, 1988). The Northern Hardwood forest type is found on slopes and in coves at elevations above 1,200 m and is dominated by yellow birch, basswood, buckeye, northern red oak, yellow poplar, and black cherry. The cove hardwood forests grow primarily along moist ravines at elevations below 1,200 m and are dominated by yellow poplar and hemlock with smaller amounts of red maple, northern red oak, hickory, and black birch. The oak forest type is widely distributed on north-facing slopes at elevations below 1,200 m. Chestnut oak is the dominant species with variable amounts of scarlet oak, northern red oak, and white oak. The oak-pine community type, which is dominated by pitch pine and scarlet oak, is found at lower elevations on dry, south-facing slopes and ridgetops.
Most soils in the basin are classified as Ultisols and are mapped in the Tusquitee-Edneyville-Porters soil association, which includes steep, well-drained loamy soils formed in residuum weathered from schist and gneiss (Carson and Green, 1981). These soils are characterized by a reddish to grayish-brown surface layer of loam (20 cm) overlying a subsoil of yellowish-brown, sandy to clayey loam extending to a depth of 150 cm or more. Chemically, these soils have a high-organic matter content (5 to 15 percent), are moderately acidic (pH 4.74 to 5.13), and have low cation-exchange capacities (Swank and Crossley, 1988). The dominant soil minerals are detrital feldspar, biotite, and garnet and pedogenic kaolinite and gibbsite (Velbel, 1988).
The basin lies in the Southern Appalachian Blue Ridge geologic province and is underlain by rocks of late Proterozoic to early Paleozoic age belonging to the Richard Russell Formation and Coweeta Group (Peper and others, 1991; Hatcher, 1988). Both units contain gneiss, schist, amphibolite, and calc-silicate rocks, but the Richard Russell Formation tends to be coarser grained and more migmatized than the Coweeta Group. The mineralogy of both units is similar and
 |
The Tallulah River Basin drains parts of Towns and Rabun Counties in northeastern Georgia and Clay County in western North Carolina. Land in the basin is entirely in the boundaries of the Chattahoochee and Nantahala National Forests, of which 32 percent is in the Southern Nantahala Wilderness and 19 percent is privately owned. The main road into the basin enters near the gage and roughly parallels the main channel to within 2.5 km of the northern basin boundary. Paved and gravel roads provide access to most major tributaries, although travel in the wilderness is limited to foot trails. A portion of the Appalachian Trail follows most of the ridgeline in the northern one-half of the basin. The steep, heavily forested slopes make travel off roads and trails difficult.
Logging was important in the history of the area (Douglass and Hoover, 1988), and most of the basin probably was logged at least once prior to the establishment of the Chattahoochee and Nantahala National Forests in the mid-1930's. Current (1997) land cover in the National Forest is almost 100 percent forest, and the primary land-use activities are timber production and recreation. Timber harvesting in the basin during the past 10 years has averaged 140 ha annually (David Jensen, Forest Service, written commun., 1996). The method of cutting used prior to 1990 was largely clearcutting; however, seedtree, shelterwood, group selection, and single tree selection have become the standard during the past 5 years (David Jensen, written commun., 1996). Recreational use has increased significantly during the past 20 years, and campgrounds along the river are in high demand throughout the summer season. Roads are a major source of sediment loading to streams during storm events. During the last 5 years, the Forest Service has rebuilt bridges and paved or upgraded roads along drainages in an effort to reduce erosion of sediment to surface waters. The most substantial land-use change in the National Forest during the past 30 years was the designation of the Southern Nantahala Wilderness in 1984. Both the Chattahoochee and Oconee National Forests are in the process of revising their current management plans (David Jensen, written commun., 1996). These revisions may result in future increased areas of wilderness in the basin and provide Wild and Scenic designation for some segments of the Tallulah River upstream from the gage.
Private land in the basin is currently 78 percent forested, 17 percent cleared, and 5 percent residential (David Jensen, written commun., 1996) and is concentrated in the Persimmon Creek subbasin, along the valley floor near Tate City, and along the flood plain downstream from the Coleman River confluence. The primary land-use activities in these areas are cattle grazing and hay production with some poultry production, logging, and crop production. Three relatively new residential subdivisions are in the Persimmon Creek subbasin; two have about 20 new houses and the third is currently (1997) being developed (David Jensen, written commun., 1996). There are several small prospects and mines in the basin, but all are inactive (Peper and others, 1991).
The Tallulah River gage was operated by the USGS as a discharge-only station until it was removed from the HBN in 1994. Water-quality samples were collected periodically at the gage from March 1967 through July 1990 as part of a USGS program to monitor pristine surface-water sites in Georgia (James McConnell, U.S. Geological Survey, oral commun., 1996). Samples were collected on a biannual schedule and were analyzed for a suite of chemical constituents similar to those measured at other HBN stations. Partial analyses for an additional 22 samples also are stored in NWIS. These samples were collected as part of a State water-quality assessment program and were analyzed at the Georgia Department of Natural Resources (James McConnell, oral commun., 1996). Daily discharge records for the Tallulah River (station 02178400) are available beginning in July 1964. Records of daily water temperature at the gage from September 1964 through September 1979 also are available.
Calculated ion balances for 48 samples with complete major ion analyses are shown in Figure 11a and 11b. Temporal variation of discharge, field pH, major ion concentrations, and ion balance at Tallulah River, Georgia. Ion balances ranged from -26 to +7 percent, and less than 65 percent of the samples had calculated values within the ±10 percent range. This wide range of values reflects the difficulty in making precise analytical measurements at the low solute concentrations typical of this station. The average ion balance for all samples was -8.5 percent, and almost 90 percent had negative ion balances, indicating that the samples had an excess of measured anions over cations. Because stream samples at this station generally have low alkalinities, the apparent anion excess probably is because of an overestimation of alkalinity by the fixed-endpoint titration to pH 4.5 (Office of Water Quality Technical Memorandum No. 80.27, New Parameter Codes for pH, Alkalinity, Specific Conductance, and Carbonate/ Bicarbonate, issued September 19, 1980, at URL http://water.usgs.gov/admin/memo/). For waters with alkalinities around 100 meq/L, however, the endpoint pH is closer to 5.0, and titration to pH 4.5 may overestimate alkalinity by as much as 25 meq/L (Barnes, 1964). Because the average alkalinity and anion excess for this station were 140 meq/L and 30 meq/L, respectively, a bias in the laboratory alkalinity appears to be a reasonable explanation for the negative ion balances.
Time-series plots of the major dissolved constituents were inspected for evidence of method-related effects (fig. 11). Several patterns are evident in the sulfate and field pH records. For example, sulfate concentrations between 1970 and 1972 were all reported as less than or equal to 42 meq/L (2 mg/L), which was
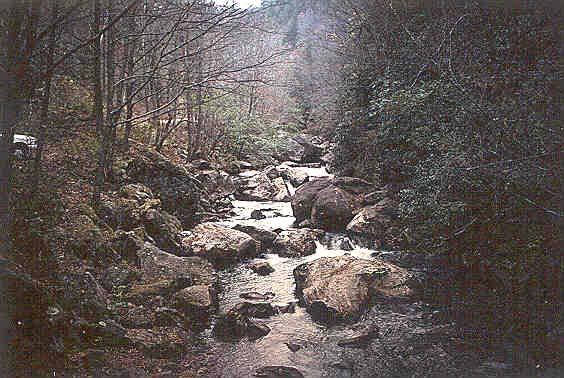 |
Table 18 gives median concentrations and ranges of major constituents in stream water collected at the gage and VWM concentrations in wet-only deposition measured at the Coweeta NADP station about 10 km northeast of the basin. Precipitation chemistry at the NADP station is dilute and slightly acidic, with a VWM pH of 4.6 for 17 years of record. The dominant cations in precipitation were hydrogen, which contributed 58 percent of the total cation charge, and ammonium and sodium, which contributed 18 and 13 percent, respectively. Sulfate was the dominant anion, accounting for 64 percent of the total anion charge, and nitrate and chloride accounted for 25 and 13 percent, respectively. The predominance of these ions indicates that precipitation in the basin is primarily a mixture of strong acids derived from anthropogenic emissions of sulfur and nitrogen compounds, which cause acid rain.
[Concentrations in units of microequivalents per liter, discharge in cubic meters per second, specific conductance in microsiemens per centimeter at 25 degrees Celsius, and silica in micromoles per liter; n, number of stream samples; VWM, volume-weighted mean; inst., instantaneous; spec. cond., specific conductance; <, less than; --, not measured]
| Parameter | Stream Water | Precipitation VMAa | |||||
| Minimum | First quartile | Median | Third quartile | Maximum | n | ||
| Discharge | 1.1 | 2.2 | 3.7 | 5.1 | 16 | 49 | -- |
| Spec. cond., field | 12 | 15 | 17 | 20 | 25 | 49 | -- |
| pH, field | 5.9 | 6.6 | 6.9 | 7.1 | 7.3 | 34 | 4.6b |
| Calcium | <5.0 | 55 | 60 | 70 | 130 | 49 | 3.5 |
| Magnesium | 8.2 | 32 | 34 | 40 | 48 | 49 | 1.5 |
| Sodium | 30 | 43 | 52 | 61 | 78 | 49 | 5.4 |
| Potassium | 7.7 | 10 | 13 | 15 | 21 | 49 | .5 |
| Ammonium | <.7 | .7 | 1.4 | 2.9 | 7.1 | 18 | 7.8 |
| Alkalinity, laboratory | 40 | 120 | 140 | 160 | 200 | 48 | -- |
| Sulfate | <8.3 | <21 | 21 | 35 | 90 | 49 | 28 |
| Chloride | 11 | 17 | 22 | 25 | 56 | 49 | 5.6 |
| Nitrite plus nitrate | <1.4 | 3.9 | 3.9 | 7.1 | 79 | 27 | 11c |
| Silica | 90 | 130 | 140 | 160 | 180 | 45 | -- |
a Data are volume-weighted mean concentrations for 1978—94.
b Laboratory pH.
c Nitrate only.
Stream water in the Tallulah River is very dilute and poorly buffered; specific conductances ranged from 12 to 25 µS/cm and alkalinities were generally between 120 and 160 meq/L. The major cations in stream water were calcium and sodium and alkalinity was the dominant anion. The primary source of base cations and alkalinity in stream water probably is weathering of silicate minerals in the underlying gneiss and schist. The median chloride concentration in stream water was 22 meq/L, which is about four times larger than the VWM concentration of 5.6 meq/L in precipitation. On the basis of the difference between average annual runoff and precipitation, evapotranspiration can account for no more than a threefold increase in the concentration of precipitation, indicating that a small amount of chloride may be derived from sources other than wet deposition. Swank and Waide (1988) determined that dry deposition from the atmosphere accounted for about 15 percent of the annual chloride input to streams that drain the nearby Coweeta Basin. Alternatively, weathering of hornblende in the bedrock also may contribute small amounts of chloride to surface waters (Peters, 1991), as would some human activities in the basin. The median concentration of sulfate in stream water (21 meq/L) was smaller than the VWM concentration of 28 meq/L in wet precipitation. Considering that dry deposition of sulfate in the Southern Blue Ridge has been estimated to be comparable to that of wet deposition (Elwood and others, 1991), it appears that much of the atmospherically deposited sulfate is currently being retained in the basin. The primary mechanism probably is sulfate adsorption on soils, which also acts to buffer surface waters from the effects of acidic deposition (Elwood and others, 1991). The lower concentration of both nitrate and ammonium in stream water compared to precipitation indicates nitrogen also is strongly retained in the basin but also indicates that upstream agricultural activities do not have a substantial effect on nutrient concentrations in stream water at the gage.
The solute composition of stream water was further evaluated by analyzing correlations between solutes and stream discharge (table 19). Base cations, silica, and alkalinity had strong inverse correlations with discharge, which is consistent with a hydrologic system where weathering-enriched base flow is diluted by waters from shallow or surficial sources during periods of increased discharge. Among the ions, the highest degree of correlation was found between sodium and silica (rho = 0.908), which most likely reflects the weathering of feldspars in the underlying gneiss and schist. As expected, the atmospherically derived constituents showed little correlation with the major weathering products with the exception of a positive correlation between calcium and sulfate (rho = 0.632). Although most sulfate is retained in the basin soils, this association indicates that mobilization of sulfate from the basin may be causing the export of soil calcium to the stream (Johnson and Ruess, 1984).
[Q, discharge; Ca, calcium; Mg, magnesium; Na, sodium; K, potassium; Alk, alkalinity; SO4, sulfate; Cl, chloride; Si, silica]
| Q | pH | Ca | Mg | Na | K | Alk | SO4 | Cl | |
| pH | -0.262 | ||||||||
| Ca | -.682 | 0.500 | |||||||
| Mg | -.706 | .518 | 0.632 | ||||||
| Na | -.834 | .182 | .566 | 0.688 | |||||
| K | -.702 | .137 | .347 | .583 | 0.734 | ||||
| Alk | -.718 | .308 | .689 | .735 | .683 | 0.635 | |||
| SO4 | -.385 | .532 | .632 | .465 | .184 | .215 | 0.485 | ||
| Cl | .173 | .387 | -.067 | .143 | .036 | .033 | .105 | -0.001 | |
| Si | -.927 | .235 | .625 | .744 | .908 | .687 | .657 | .267 | -0.180 |
Results of the seasonal Kendall test for trends in discharge and major dissolved constituents are shown in table 20. Because many
 |
[Trends in units of microequivalents per liter per year, except discharge in cubic meters per second per year, pH in standard units per year, and silica in micromoles per liter per year; <, less than; --, not calculated]
| Parameter | Unadjusted | Flow adjusted | ||
| Trend | p-value | Trend | p-value | |
| Discharge | -0.01 | 0.929 | -- | -- |
| pH, field | .08 | .008 | 0.08 | 0.008 |
| Calcium | 1.6 | .028 | 1.2 | .030 |
| Magnesium | .5 | .168 | .4 | .199 |
| Sodium | .4 | .528 | .2 | .507 |
| Potassium | <.1 | .548 | <.1 | .825 |
| Alkalinity, laboratorya | -- | -- | -- | -- |
| Sulfate | <.1 | .365 | (b) | -- |
| Chloride | <.1 | .385 | (b) | -- |
| Nitrite plus nitrate | (a) | -- | -- | -- |
| Silica | .6 | .561 | .5 | .268 |
a Insufficient data to calculate trend.
b Flow model not significant at a = 0.10.
Results of the surface-water synoptic sampling conducted October 27 and 28, 1991, are given in table 21; locations of sampling sites are shown in figure 10. Discharge at the gage was 2.0 m³/s compared to the median daily discharge of 2.7 m³/s for October (Lawrence, 1987), indicating that the basin was sampled during normal conditions for that time of year. Solute concentrations measured at the gage (site 1) during the synoptic sampling were generally between the median and third-quartile concentrations at the gage during the entire period of record (table 18). Tributary streams were similar in composition to the gage, with calcium and sodium the dominant cations and alkalinity the dominant anion. All samples had ion balances close to zero (range -2.5 to 4.9 percent), indicating that organic anions probably did not contribute significantly to the ionic content of stream water at the time of sampling.
[Site locations shown in fig. 10; Q, discharge in cubic meters per second; SC, specific conductance in microsiemens per centimeter at 25 degrees Celsius; pH in standard units; Ca, calcium; Mg, magnesium; Na, sodium; K, potassium; Alk, alkalinity; SO4, sulfate; Cl, chloride; NO3, nitrate; concentrations in microequivalents; Si, silica in micromoles per liter; <, less than; --, not measured]
| Site | Station number | Q | SC | pH | Ca | Mg | Na | K | Alk | Cl | NO3 | SO4 | Si | Criteriaa | Remarks |
| 1 | 02178400 | 1.98 | 20 | 7.12 | 65 | 41 | 57 | 15 | 150 | 20 | 1.4 | 15 | 153 |
|
|
| 2 | 345324083314500 | .68 | 24 | 7.18 | 75 | 40 | 87 | 19 | 170 | 22 | 5.0 | 14 | 190 | MT, LU | Agriculture |
| 3 | 345407083305200 | -- | 31 | 7.21 | 110 | 62 | 91 | 31 | 230 | 28 | 16 | 13 | 210 | LU | Agriculture |
| 4 | 345447083300300 | -- | 24 | 7.17 | 65 | 37 | 110 | 18 | 170 | 22 | 4.3 | 19 | 230 | LU | Agriculture |
| 5 | 345448083300700 | .28 | 21 | 7.21 | 65 | 30 | 78 | 18 | 150 | 22 | 2.9 | 12 | 180 | LU | Agriculture |
| 6 | 345509083335600 | .14 | 14 | 6.87 | 41 | 24 | 43 | 11 | 89 | 17 | <.7 | 11 | 120 | MT | Rural residences |
| 7 | 345549083324600 | .23 | 13 | 6.94 | 33 | 19 | 43 | 11 | 83 | 17 | <.7 | 12 | 120 | MT | Forested |
| 8 | 345706083331300 | .22 | 15 | 7.06 | 44 | 22 | 48 | 13 | 98 | 16 | <.7 | 11 | 130 | LU | Forested |
| 9 | 345739083332700 | .40 | 21 | 7.20 | 85 | 37 | 57 | 14 | 150 | 17 | <.7 | 33 | 150 | LU | Downstream from Tate City |
| 10 | 345924083332500 | .040 | 23 | 7.12 | 110 | 33 | 57 | 13 | 160 | 11 | <.7 | 42 | 140 | BG | Sulfide mineralization |
| 11 | 350043083332600 | .053 | 20 | 7.13 | 90 | 23 | 61 | 13 | 140 | 16 | <.7 | 25 | 140 | LU | Wilderness |
a Criteria used in selection of sampling sites: BG = bedrock geology, MT = major tributary, LU = land use.
Visual inspection of the synoptic data indicates that land-use activities explain most of the spatial variation in water quality at the time of the synoptic sampling. Although nitrate concentrations were extremely low at all the sampling sites (less than 17 meq/L), only tributaries that drain areas of the basin with agricultural activities (sites 2-5) had detectable concentrations of nitrate. These sites also had slightly elevated concentrations of alkalinity, silica, sodium, potassium, and chloride compared to sites that drain largely undeveloped subbasins (sites 6-8, 10, and 11). For example, alkalinity averaged 180 meq/L and silica averaged 200 meq/L in the agricultural subbasins compared to 110 meq/L and 140 meq/L, respectively, in the forested subbasins. Chloride averaged 24 meq/L and sodium averaged 92 meq/L in the agricultural areas compared to 15 meq/L and 50 meq/L, respectively, in the forested subbasins. These differences in chemistry indicate that landscape disturbance related to agriculture and possibly septic tank leakage had a minor, although detectable, impact on the chemistry of surface waters during the sampling period. The impact of these disturbed areas on stream chemistry and sediment load, however, may increase disproportionately during periods of high runoff. Abandoned mines and prospects also may affect the chemistry of some surface waters in the basin. For example, Beech Creek (site 10), which was sampled downstream from a mapped mine and mineralized zone, had the highest sulfate and calcium concentration of the forested tributaries. The mine was not sampled during the synoptic sampling, but the slightly elevated concentrations measured in this tributary are consistent with the weathering sulfide minerals in the ore deposit.
Bailey, R.G., Avers, P.E., King, T., and McNab, W.H., eds., 1994, Ecoregions and subregions of the United States with supplementary table of map unit descriptions: Washington, D.C., U.S. Depart ment of Agriculture Forest Service, scale 1:7,500,000 (also at URL http://www.fs.fed.us/land/ecosysmgmt/ ecoreg1_home.html).
Carson, W.S., and Green, T.W., 1981, Soils survey of Rabun and Towns Counties, Georgia: U.S. Department of Agriculture Soil Conservation Service, 97 p.
Day, F.P., Jr., Phillips, D.L., and Monk, C.D., 1988, Forest communities and patterns, in Swank, W.T., and Crossley, D.A., Jr., eds., Forest hydrology and ecology at Coweeta: New York, Springer-Verlag, p. 141-150.
Douglass, J.E., and Hoover, M.D., 1988, History of Coweeta, in Swank, W.T., and Crossley, D.A., Jr., eds., Forest hydrology and ecology at Coweeta: New York, Springer-Verlag, p. 17-34.
Elwood, J.W., Sale. M.J., and Kaufman, P.R., 1991, The Southern Blue Ridge Province, in Charles, D.F., ed., Acidic deposition and aquatic ecosystems-Regional case studies: New York, Springer-Verlag, p. 319-364.
Hatcher, R.D., Jr., 1988, Bedrock geology and regional geologic setting of Coweeta Hydrologic Laboratory in the eastern Blue Ridge, in Swank, W.T., and Crossley, D.A., Jr., eds., Forest hydrology and ecology at Coweeta: New York, Springer-Verlag, p. 81-92.
Johnson, D.W., and Ruess, J.O., 1984, Soil mediated effects of atmospherically deposited sulphur and nitrogen: Philosophical Transactions of the Royal Society of London, ser. B, v. 305, p. 383-392.
Lawrence, C.L., 1987, Streamflow characteristics at hydrologic bench-mark stations: U.S. Geological Survey Circular 941, 123 p.
Peper, J.D., Lesure, F.G., Cox, L.J., and D-Agostino, J.P., 1991, Geology, geochemistry, and mineral resource assessment of the Southern Nantahala Wilderness and adjacent roadless areas, Rabun and Towns Counties, Georgia, and Clay and Macon Counties, North Carolina: U.S. Geological Survey Bulletin 1883, 30 p.
Peters, N.E., 1991, Chloride cycling in two forested lake watersheds in the west-central Adirondack Mountains, New York, U.S.A.: Water, Air, and Soil Pollution, v. 59, p. 201-215.
Swank, W.T., and Crossley, D.A., Jr., 1988, Introduction and site description, in Swank, W.T., and Crossley, D.A., Jr., eds., Forest hydrology and ecology at Coweeta: New York, Springer-Verlag, p. 3-16.
Swank, W.T., and Waide, J.B., 1988, Characterization of baseline precipitation and stream chemistry and nutrient budgets for control watersheds, in Swank, W.T., and Crossley, D.A., eds., Forest hydrology and ecology at Coweeta: New York, Springer-Verlag, p. 57-79.
Swift, L.W., Jr., and Waide, J.B., 1988, Characterization of baseline precipitation and stream chemistry and nutrient budgets for control watersheds, in Swank, W.T., and Crossley, D.A., Jr., eds., Forest hydrology and ecology at Coweeta: New York, Springer-Verlag, p. 57-80.
U.S. Geological Survey, published annually, Water resources data, Georgia, Atlanta: U.S. Geological Survey Water Data Report.
Velbel, M.A., 1988, Weathering and soil-forming processes, in Swank, W.T., and Crossley, D.A., Jr., eds., Forest hydrology and ecology at Coweeta: New York, Springer-Verlag, p. 93-102.
a. U.S. Geological Survey topographic maps:
b. Geologic maps:
c. Soil surveys:
d. Other maps
Table B-1. NWIS site identification numbers and site names for water-quality sampling sites.
| Site | Identification Number | Site Name |
| 1 | 02178400 | TALLULAH RIVER CLAYTON GEORGIA |
| 2 | 345324083314500 | PERSIMMON CR BLW PERSIMMON |
| 3 | 345407083305200 | HIGH SHOALS CR NR PERSIMMON |
| 4 | 345447083300300 | LITTLE PERSIMMON CR NR PERSIMMON |
| 5 | 345448083300700 | PERSIMMON CR AB PERSIMMON |
| 6 | 345509083335600 | PLUM ORCHARD CR NR PERSIMMON |
| 7 | 345549083324600 | COLEMAN R NEAR TATE CITY |
| 8 | 345706083331300 | CHARLES CREEK NR TATE CITY |
| 9 | 345739083332700 | TALLULAH R BLW TATE CITY |
| 10 | 345924083332500 | BEECH CR NR TATE CITY |
| 11 | 350043083332600 | TALLULAH R AB TATE CITY |
| Back to 1173-A Contents |
This page maintained by Nichole Bisceglia.
Last updated July 31, 2000.