
Hydrologic Benchmark Network Stations in the Eastern U.S. 1963-95 (USGS Circular 1173-A)
| Abstract and Map Index | List of all HBN Stations | Introduction to Circular | Analytical Methods |
To download a printer friendly PDF version of this information click here.
This report details one of the approximately 50 stations in the Hydrologic Benchmark Network (HBN) described in the four-volume U.S. Geological Survey Circular 1173. The suggested citation for the information on this page is:
|
All of the tables and figures are numbered as they appear in each circular. Use the navigation bar above to view the abstract, introduction and methods for the entire circular, as well as a map and list of all of the HBN sites. Use the table of contents below to view the information on this particular station.
|
|
| 1. Site Characteristics and Land Use |
| 2. Historical Water Quality Data and Time-Series Trends |
| 3. Synoptic Water Quality Data |
| 4. References and Appendices |
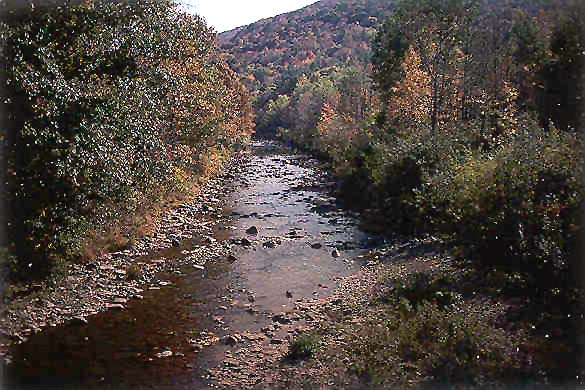
The Esopus Creek HBN Basin is in the Catskill Mountains in southeastern New York in the Appalachian Plateaus physiographic province (Figure 18. Map of the study area in the Esopus Creek Basin and photograph of the stream channel near the town of Big Indian, New York). The basin drains 165 km² of steep, mountainous terrain that ranges in elevation from 304 m at the gage to 1,145 m at the summit of Panther Mountain. The USGS gaging station is 0.8 km west of the town of Allaben, N.Y., at latitude 42°07'01'' and longitude 74°22'50''. The channel length of Esopus Creek upstream from the gage is about 20 km, and stream gradients range from 10 m/km near the gage to 220 m/km in the headwater tributaries. Esopus Creek flows southeast into Ashokan Reservoir, 21 km downstream from the gage, which provides drinking water for the city of New York. The main channel is perennial, and mean monthly discharge ranges from 0.86 m³/s in August to 9.5 m³/s in April. Average annual runoff was 74 cm from 1964 through 1995 (U.S. Geological Survey, Water Resources Data, New York). Climate of the area is characterized by cold winters and moderately warm summers with average daily air temperatures that range from -4.2°C in January to 21.5°C in July (Tornes, 1979). Annual precipitation rates in the headwaters of Esopus Creek are among the highest in the Northeast (Kudish, 1979). A National Weather Service station near Winnisook Lake (elevation 808 m) receives an average of 157 cm/yr of precipitation, of which 18 percent falls as snow (Murdoch, 1991). Annual precipitation decreases with elevation in the Catskill Mountains at a rate of about 6.5 cm per 100 m (Kudish, 1979). Therefore, average annual precipitation at the gage was estimated to be 125 cm.
 |
The basin lies in the Adirondack-New England Mixed Forest ecoregion (Bailey and others, 1994); the forest can be separated into two major zones the Northern Hardwood forest type at altitudes below 1,000 m and the Spruce-Fir type above 1,000 m. The dominant hardwood species are American beech, sugar maple, yellow birch, black cherry, red maple, white ash, and red oak. Spruce- fir forests are dominated by red spruce and balsam fir with mountain ash and occasionally paper birch. A more complete description of forests in the Catskill Mountains can be found in Kudish (1971). Soils in the basin are classified as Inseptisols and are mapped in the Arnot-Oquaga-Lackawanna soil association (Tornes, 1979). They are well-drained, bouldery, silt loams developed in till derived from reddish sandstone and shale. Soils in the Lackawanna series have a dense fragipan 50 cm or more below the surface that restricts rooting and slows the infiltration of water. Chemically, the soils are acidic (mean pH of 4.4), have low cation-exchange capacities (5.7 meq/100 g of soil), and low sulfate-adsorption capacities (Murdoch and Stoddard, 1993).
Bedrock that underlies the basin consists of gently sloping to flat-lying shales, sandstones, and conglomerates of Devonian age. The sediments were uplifted as a broad plateau and subsequently dissected into steep-walled valleys by the action of streams and glaciers. Mineralogic differences among the sedimentary rocks in the Catskill Mountains are minor, and most sediments are composed of detrital quartz (70 percent), fine-grained metamorphic rock fragments (16 percent), and minor amounts of mica and feldspar (Ethridge, 1977). Trace amounts of calcite and hematite also are present as cement materials in the sandstones. The glacial history of the Catskill Mountains is complex owing to the presence of both a continental ice sheet and local alpine-type glaciers (Rich, 1935). Till in the Esopus Creek drainage is derived predominantly from Catskill rocks to the north and consists of an unsorted mixture of clay, sand, and boulders that range in thickness from a few centimeters on the summits to more than 40 m along the valley bottoms (Kudish, 1979).
The Esopus Creek Basin drains parts of Green and Ulster Counties and is in the boundaries of the Catskill Park. The Catskill Park is a State Forest Preserve that is interspersed with private holdings. The preserve is administered by the New York State Department of Environmental Conservation under the guidelines of the Catskill Park State Land Plan (McAllister and Ochman, 1992). The basin also is in the 1,479-km² Catskill Reservoir District, which together with the Schoharie Basin provides 40 percent of New York City's drinking water (Perry, 1971; Freud, 1991). Access into the basin is by way of State Highways 28 and 42, which are paved roads that traverse the basin along the Birch Creek and Bushnellsville Creek drainages, respectively. Both highways are open year-round and are salted and plowed in winter. A gravel road parallels the main Esopus Creek drainage between Big Indian and Winnisook Lake. Earthen roads follow many of the smaller tributary streams to access residential areas. Access to the upper slopes and ridges is limited to foot trails.
Details of the settlement and land-use history of the Catskill region can be found in Kudish (1979) and McIntosh (1972). Extensive settlement and disturbance by Europeans began in the early 1800's when the Catskill Mountains became the center of a large tanning industry that harvested the native hemlock forests for tanbark. Sawmills also were operated in the area, cutting hardwoods and pines for barrels and other wood products. By the end of the 19th century, most of the Catskill forests had been cut at least once, and only forests above 850 m in altitude remained undisturbed (McIntosh, 1972).The Catskill Mountains gained increasing popularity as a resort and recreation area in the mid-1800's (Francis, 1983), and the upper slopes and summits were designated a State Forest Preserve in 1870.
 |
Current (1997) land cover in the basin is about 94 percent forest, 5 percent residential, and less than 1 percent agricultural and commercial. Most State-owned lands in the basin are designated as wilderness and are protected from future development. Most land-use activities in the basin are related to the road network and residential population. More than 3,000 full- and part-time residents live in six small communities and in scattered residential areas that are localized along the main drainage and major tributaries. The basin also contains several impoundments and a wastewater-treatment plant that was constructed in 1925 downstream from the community of Pine Hill. Three sand and salt piles for winter highway maintenance are currently stored at public garages in the communities of Allaben and Big Indian (James Mayfield, New York City Department of Environmental Protection, written commun., 1993). The most significant land-use change since the gage was established has been an increase in residential population. Census data are not available specifically for the HBN basin; however, the population of the Esopus Creek Basin upstream from the Ashokan Reservoir increased 147 percent between 1940 and 1980. During the same period, residential land use in the basin increased 230 percent, whereas commercial and agricultural land use decreased 80 percent (Freud, 1991).
The data set analyzed for this report includes 233 water-quality samples that were collected from August 1963 through August 1992 when the station was removed from the HBN. Sampling frequency progressively increased from 2 samplings per year in 1963 to 12 samplings per year in 1968. Sampling frequency was monthly from 1968 through 1982, then quarterly from 1983 through 1992. Water-quality samples were analyzed at a USGS laboratory in Albany, N.Y., from 1964 through 1977, the USGS Central Laboratory in Atlanta, Ga., from 1978 through 1985, and at the NWQL in Arvada, Colo., from 1986 through 1992. Daily discharge records for Esopus Creek (station 01362198) are available beginning in October 1963. Daily water temperature at the gage was measured from July 1963 through July 1968, January 1970 through May 1994, and after January 1995. In October 1988, the gage was moved 0.8 km downstream owing to the increasing popularity of a swimming hole near the former gage site (A.J. Ranalli, U.S. Geological Survey, oral commun., 1994). Records after 1988 for the relocated station are published as Esopus Creek at Allaben (station 01362200).
 |
Calculated ion balances for 228 samples with complete major ion analyses are shown in figure 19. Ion balances ranged from -26 to +36 percent, and 90 percent of samples had values within the ±10 percent range, indicating the analytical results were of good quality. The average charge balance for all samples was -0.9 percent, indicating that unmeasured constituents, such as organic anions, do not contribute substantially to the ionic composition of stream water at this station. Time-series plots of major dissolved constituents were inspected for evidence of analytical-related influences (Figures 19a and 19b. Temporal variation of discharge, field pH, major ion concentrations, and ion balance at Esopus Creek, New York). At least two patterns are evident at the Esopus Creek station in the middle part of the record. For example, field pH values decreased somewhat abruptly around 1976, remained low for the next several years, then increased again around 1980. This pattern coincides with a period when pH was determined in the field by using a water-quality analyzer produced by the Hydrolab Corporation (N.E. Peters, U.S. Geological Survey, oral commun., 1994). It has been documented that, in low ionic-strength water, the Hydrolab can produce errors as large as one pH unit when used with a standard reference electrode (Hydrolab, 1992). The usual result of this combination is a lower than expected pH, which is consistent with the low values reported at this site in the late 1970's. A somewhat sudden change also occurred in the calculated ion balance around the beginning of 1975, but the cause of the shift could not be identified. A similar pattern was not observed in the major ionic constituents, indicating the shift was not caused by a bias in any individual constituent. In addition, the pattern did not coincide with any documented changes in analytical methods or field-related activities.
Median concentrations and ranges of major constituents in stream water collected at the HBN gaging station and VWM concentrations in wet-only precipitation measured at the Biscuit Brook NADP station are listed in table 34. Precipitation chemistry at Biscuit Brook, which is about 5 km west of Winnisook Lake, is dilute and acidic with a VWM pH of 4.3 for 10 years of record. The dominant cations in precipitation were hydrogen, which contributed 74 percent of the total cation charge, and ammonium, which contributed 15 percent. Sulfate and nitrate were the dominant anions, accounting for 61 and 33 percent of the anion charge, respectively. The low pH and predominance of strong acid anions indicates that precipitation at the NADP station probably is affected by anthropogenic emissions of sulfur and nitrogen compounds, which cause acid rain.
[Concentrations in units of microequivalents per liter, discharge in cubic meters per second, specific conductance in microsiemens per centimeter at 25 degrees Celsius, pH in standard units, and silica in micromoles per liter; n, number of stream samples; VMW, volume-weighted mean; inst., instantaneous; spec. cond., specific conductance at 25 degrees Celsius; pH in standard units; <, less than; --, not reported]
| Parameter | Stream Water | Precipitation VMAa | |||||
| Minimum | First quartile | Median | Second quartile | Maximum | n | ||
| Discharge, inst. | 0.12 | 0.91 | 2.5 | 5.1 | 29 | 232 | -- |
| Spec. cond., field | 31 | 45 | 51 | 61 | 82 | 230 | -- |
| pH, field | 4.9 | 6.6 | 6.9 | 7.3 | 8.7 | 229 | 4.3b |
| Calcium | 130 | 240 | 260 | 310 | 460 | 233 | 3.0 |
| Magnesium | 50 | 92 | 100 | 110 | 190 | 233 | 1.4 |
| Sodium | 35 | 70 | 93 | 120 | 230 | 232 | 3.3 |
| Potassium | <2.5 | 8.0 | 8.0 | 10 | 18 | 232 | .4 |
| Ammonium | <.7 | <.7 | 2.1 | 3.6 | 18 | 91 | 11 |
| Alkalinity, laboratory | 39 | 160 | 210 | 300 | 500 | 228 | -- |
| Sulfate | 25 | 150 | 160 | 170 | 310 | 230 | 44 |
| Chloride | 17 | 70 | 96 | 130 | 370 | 230 | 4.5 |
| Nitrite plus nitrate | <.7 | 11 | 19 | 28 | 58 | 139 | 24c |
| Silica | 17 | 40 | 43 | 47 | 61 | 231 | -- |
aValues are volume-weighted mean concentrations for 1983-94.
bLaboratory pH.
cNitrate only.
Stream water in Esopus Creek is dilute and weakly buffered; total ionic constituents ranged from 220 to 780 meq/L, and alkalinities were generally between 160 and 300 meq/L. The major cations in stream water were calcium and magnesium, and the dominant anions were alkalinity and sulfate. The low concentrations of weathering-derived constituents, particularly alkalinity, reflect the slow weathering rates of the sandstone bedrock. High rates of acidic deposition probably also contribute to the low stream-water alkalinities at this station. The median chloride concentration in stream water was 96 meq/L, compared to the VWM concentration of 4.5 meq/L in precipitation, indicating that a substantial fraction of stream-water chloride is derived from sources in the basin. Because the bedrock contains only minor amounts of halite (Murdoch, 1991), it is likely that human activities such as application of deicing salts and discharge of sewage effluent are the primary sources of chloride in stream water. The median sulfate concentration of 160 meq/L in stream water was 3.6 times larger than the VWM concentration, 44 meq/L, in wet precipitation. Based on the difference between average annual precipitation and runoff, evapotranspiration can account for no more than a twofold increase in the concentration of precipitation, indicating that a substantial amount of stream-water sulfate is derived from sources other than wet deposition. Dry deposition is generally assumed to be the source of additional stream-water sulfate if no other sources are present in the basin. Some sulfate may be released from weathering of trace amounts of pyrite in the sandstones; however, this source is believed to be minor relative to atmospheric sulfate in Catskills streams (Murdoch, 1991). Nitrate concentrations in stream water were slightly smaller than in precipitation and had the same range of concentrations that was measured in pristine headwater streams throughout the Catskill Mountains (Murdoch and Stoddard, 1993).
 |
The solute composition of stream water was further evaluated by analyzing correlations between solutes and stream discharge (table 35). Base cations and alkalinity were inversely correlated with discharge. These results are consistent with a hydrologic system where weathering-enriched base flow is diluted by waters from shallow or surficial sources during periods of increased discharge. Among the solutes, the strongest correlations were found between calcium and magnesium (rho = 0.900) and sodium and chloride (rho = 0.876). Silica was not correlated with the other dissolved constituents or with discharge. The positive correlations between calcium, magnesium, and alkalinity and lack of correlation with silica are consistent with the weathering stoichiometry of carbonate minerals. Trace amounts of carbonates are present as cements in the sedimentary rocks and possibly as limestone fragments in the glacial till (Murdoch and Barnes, 1991). The influence of human activities on stream chemistry is further supported by the strong positive correlation between sodium and chloride. The processes that control silica in stream water are not clear, particularly since concentrations varied relatively little over a wide range of streamflows. Weathering of silicate minerals and metamorphic rock fragments in the sandstone and till is the most likely source of silica in ground water and to the stream during base-flow conditions. Under high-flow conditions, however, dissolution of amorphous silica minerals, biological activity, and sorption reactions in shallow ground water or soil environments may be the dominant processes that control silica concentrations in the stream (Stoddard and Murdoch, 1991).
[Q, discharge; Ca, calcium; Mg, magnesium; Na, sodium; K, potassium; Alk, alkalinity; SO4, sulfate; Cl, chloride; N, nitrite plus nitrate; Si, silica]
| Q | pH | Ca | Mg | Na | K | Alk | SO4 | Cl | N | |
| pH | -0.306 | |||||||||
| Ca | -.786 | 0.368 | ||||||||
| Mg | -.667 | .209 | 0.900 | |||||||
| Na | -.500 | .355 | .741 | 0.768 | ||||||
| K | -.329 | .126 | .453 | .467 | 0.329 | |||||
| Alk | -.693 | .335 | .678 | .553 | .302 | 0.270 | ||||
| SO4 | -.012 | -.091 | .143 | .226 | .105 | -.060 | 0.005 | |||
| Cl | -.320 | .172 | .594 | .676 | .876 | .211 | .134 | 0.223 | ||
| N | .438 | -.152 | -.312 | -.172 | -.062 | -.288 | -.433 | .069 | 0.136 | |
| Si | -.015 | -.015 | .180 | .208 | .243 | .000 | -.030 | .004 | .189 | -0.072 |
Results of the seasonal Kendall test for trends in discharge and major dissolved constituents from 1963 through 1992 are presented in table 36. Statistically significant trends were detected in sodium, chloride, nitrate, and sulfate at the 0.01 confidence level. Trends in the flow-adjusted concentrations were similar to the unadjusted concentrations, indicating that trends were not driven by changes in stream discharge. The LOWESS curves in figure 19 show that the trends in sodium and chloride were of similar magnitude and timing, and most of the increase occurred between 1972 and 1984. Increasing use of deicing salts and discharge from the wastewater-treatment plant in the basin are the most likely causes of the upward trends in these constituents. This result is consistent with trends in chloride of 1 to 3 (meq/L)/yr that were observed in other Catskill rivers from 1964 through 1990 (Freud, 1991). Freud attributed the trends to increases in population and residential land use in the region from 1950 to 1980. The upward trends in stream-water calcium and nitrate and downward trend in sulfate in Esopus Creek are consistent with trends in the chemistry of other Catskill streams (Peters and others, 1982; Stoddard, 1991; Murdoch and Stoddard, 1993). Stoddard (1991) reported significant upward trends in calcium plus magnesium concentrations in 19 Catskill streams from 1945 to 1990; he attributed the increases to landscape disturbance, which is consistent with the increase in residential population that was observed in the basin during the past 30 years. Declines in stream-water sulfate are consistent with the observed decreases in atmospheric sulfur emissions in the Northeast since 1970 (Husar and others, 1991). Unlike sulfate, the patterns in stream-water nitrate do not mimic regional trends in nitrogen deposition, which have remained stable since 1970 (Stoddard, 1991). Murdoch and Stoddard (1993) have suggested that Catskill forests are no longer able to retain incoming atmospheric nitrogen and may be approaching nitrogen saturation owing to the cumulative effects of acidic deposition.
[Trends in units of microequivalents per liter per year, except discharge in cubic meters per second per year, pH in standard units per year, and silica in micromoles per liter per year; <, less than; --, not calculated
| Parameter | Unadjusted | Flow adjusted | ||
| Trend | p-value | Trend | p-value | |
| Discharge |
|
|
|
|
| pH, field |
|
|
|
|
| Calcium |
|
|
|
|
| Magnesium |
|
|
|
|
| Sodium |
|
|
|
|
| Potassium |
|
|
|
|
| Alkalinity, laboratory |
|
|
|
|
| Sulfate |
|
|
|
|
| Chloride |
|
|
|
|
| Nitrite plus nitrate |
|
|
|
|
| Silica |
|
|
|
|
a Trend calculated for 1973—92.
b Flow model not significant at a = 0.10.
Results of the surface-water synoptic sampling of October 9 and 10, 1991, are presented in table 37; locations of sampling sites are shown in figure 18. Discharge at the gage was 0.40 m³/s compared to the median daily discharge of 1.00 m³/s for October, indicating that low base-flow conditions existed for that time of year. Concentrations measured at the gage (site 1) during the synoptic sampling were generally above the third-quartile concentrations that were measured at the gage during the entire period of record (table 34). The upstream sites spanned a wide range of concentrations that bracketed the concentrations measured at the gage. Ion balances of the synoptic samples ranged from -2.8 to 4.2 percent, indicating that organic anions did not contribute substantially to the ionic content of stream water during the sampling period.
[Site locations shown in fig. 18; Q, discharge in cubic meters per second; SC, specific conductance in microsiemens per centimeter at 25 degrees Celsius; pH in standard units; Ca, calcium; Mg, magnesium; Na, sodium; K, potassium; Alk, alkalinity; SO4, sulfate; Cl, chloride; NO3, nitrate; concentrations in microequivalents per liter; Si, silica in micromoles per liter; WTP, wastewater-treatment plant; <, less than; --, not measured]
| Site | Station number | Q | SC | pH | Ca | Mg | Na | K | Alk | S04 | Cl | NO3 | Si | Criteriaa | Remarks |
| 1 | 01362198 | 0.40 | 86 | 7.4 | 420 | 150 | 170 | 12 | 350 | 160 | 270 | 6.4 | 43 | -- | -- |
| 2 | 420723074240200 | .051 | 97 | 7.6 | 550 | 13 | 270 | 13 | 550 | 170 | 200 | 9.3 | 58 | MT, LU | Residential areas |
| 3 | 420618074265400 | .035 | 130 | 8.0 | 600 | 210 | 350 | 18 | 650 | 170 | 420 | 2.0 | 42 | MT, LU | Downstream from Pine Hill WTP |
| 4 | 420656074271200 | -- | 55 | 7.0 | 310 | 140 | 78 | 11 | 340 | 150 | 26 | <.7 | 75 | LU | Undeveloped subbasin |
| 5 | 420912074274400 | .006 | 45 | 7.2 | 250 | 110 | 78 | 11 | 240 | 130 | 51 | 7.9 | 53 | LU | Upstream from Pine Hill WTP |
| 6 | 420459074265600 | -- | 44 | 6.3 | 230 | 120 | 43 | 8.2 | 200 | 150 | 31 | 14 | 48 | LU | Undeveloped subbasin |
| 7 | 420551074265800 | .19 | 49 | 7.0 | 240 | 120 | 83 | 9.5 | 190 | 150 | 85 | 1.4 | 25 | LU | Downstream from town of Oliverea |
| 8 | 420414074282900 | .006 | 50 | 6.8 | 290 | 110 | 43 | 10 | 200 | 140 | 28 | 79 | 48 | LU | Undeveloped subbasin |
| 9 | 420317074272700 | .14 | 46 | 7.0 | 220 | 99 | 83 | 8.4 | 150 | 140 | 76 | 21 | 22 | LU | Upstream from town of Oliverea |
| 10 | 420200074251400 | .001 | 48 | 7.1 | 300 | 99 | 87 | 9.5 | 210 | 170 | 39 | 54 | 40 | LU | Undeveloped subbasin |
| 11 | 420057074244600 | -- | 30 | 6.6 | 130 | 62 | 56 | 9.0 | 85 | 100 | 48 | <.7 | 11 | LU | Undeveloped subbasin |
a Criteria used in selection of sampling sites: BG = bedrock geology, MT = major tributary, LU = land use.
Considerable spatial variability in stream chemistry was measured in the basin, particularly for calcium, sodium, chloride, and alkalinity. This variability appears to reflect the density of residential areas in the basin rather than variations in natural basin characteristics, such as geology or vegetation. For example, chloride and sodium concentrations in tributaries that drain undeveloped areas, such as site 10 and site 8, were 3 to 15 times smaller than concentrations at site 3 and site 2, which drain areas with sections of highway and large residential areas. The low sodium and chloride concentration in Birch Creek at site 5 compared with those of Birch Creek at site 3 demonstrates the effect of the wastewater-treatment plant on water quality in the basin. Effluent from the wastewater-treatment plant apparently also contributes calcium, magnesium, and alkalinity to stream water, as indicated by the elevated concentrations of these constituents at site 3. These data also show that stream-water chemistry at the gage was affected by human activities in the basin. In contrast, silica and sulfate showed little variability among the sampling sites. Silica concentrations in the synoptic samples ranged from 11 to 75 meq/L, and sulfate ranged from 100 to 170 meq/L. The similarity between silica and sulfate concentrations in Birch Creek upstream and downstream from the community of Pine Hill and the wastewater-treatment plant (sites 3 and 5) demonstrates that these constituents are only minimally affected by human activities. Although elevated nitrate concentrations were expected downstream from the wastewater-treatment plant, concentrations were consistently larger in streams that drain undeveloped areas of the basin. The tributaries with the highest nitrate concentrations, site 8 and site 10, were sampled immediately downstream from ground-water discharge zones or springs. Burns (1993) noted larger nitrate concentrations in Catskill streams fed by springs and hypothesized that ground water discharging from the springs was enriched in nitrate because ground water was recharged predominantly during the nongrowing season when plant demand for nitrogen is minimal.
Bailey, R.G., Avers, P.E., King, T., and McNab, W.H., eds., 1994, Ecoregions and subregions of the United States with supplementary table of map unit descriptions: Washington, D.C., U.S. Department of Agriculture Forest Service, scale 1:7,500,000 (also at URL http://www.fs.fed.us/land/ecosysmgmt/ ecoreg1_home.html).
Burns, D.A., 1993, Effect of ground-water seeps on nitrate concentrations in stream waters in the Catskill Mountains of New York: EOS, v. 74, no. 43, p. 258.
Ethridge, F.G., 1977, Petrology, transport, and environment in isochronous Upper Devonian sandstone and siltstone units, New York: Journal of Sedimentary Petrology, v. 47, no. 1, p. 53-65.
Francis, A.M., 1983, Catskill rivers-Birthplace of American fly fishing: Piscataway, N.J., Nick Lyons Books, Winchester Press, p. 187-203.
Freud, Salome, 1991, Analysis of water quality trends for chloride in New York City's Catskill District, Esopus and Schoharie Basins: Durham, N.C., Duke University, Master's thesis, 40 p.
Husar, R.B., Sullivan, T.J., and Charles, D.F., 1991, Historical trends in atmospheric sulfur deposition and methods for assessing long-term trends in surface water chemistry, in Charles, D.F., ed., Acidic deposition and aquatic ecosystems-Regional case studies: New York, Springer-Verlag, p. 48-92.
Hydrolab, 1992, Application Note #102: Hydrolab Corporation, P.O. Box 50116, Austin, Texas, 2 p.
Kudish, M.K., 1971, Vegetational history of the Catskill High Peaks: Syracuse, N.Y., State University of Syracuse, Ph.D. dissertation, 254 p.
Kudish, M.K., 1979, Catskill soils and forest history: Hobart, N.Y., The Catskill Center for Conservation and Development, Inc., 45 p.
McAllister, Lee, and Ochman, M.S., 1992, Hiking in the Catskill Mountains: Guidebook, The New York- New Jersey Trail Conference [produced by The Whole Concept Design Studio, New York], p. 46-51.
McIntosh, R.P., 1972, Forests of the Catskill Mountains, New York: Ecological Monographs, v. 42, p. 143-161.
Murdoch, P.S., 1991, Chemical budgets and stream chemistry dynamics of a headwater stream in the Catskill Mountains of New York, October 1, 1983, through September 30, 1985: U.S. Geological Survey Water-Resources Investigations Report 88-4035, 66 p.
Murdoch, P.S., and Barnes, C.R., 1991, Stream acidification in the Catskill Mountains of New York: U.S. Geological Survey Open-File Report 91-0225, p. 7-8.
Murdoch, P.S., and Stoddard, J.L., 1993, The role of nitrate in the acidification of streams in the Catskill Mountains of New York: Water Resources Research, v. 28, no. 10, p. 2707-2720.
Peters, N.E., Schroeder, R.A., and Troutman, D.E., 1982, Temporal trends in the acidity of precipitation and surface waters of New York: U.S. Geological Survey Water-Supply Paper 2188, 35 p.
Perry, R.A., 1971, The economic impact of New York City reservoirs on the Catskill Mountain area of New York State: U.S. Geological Survey Open-File Report 76-0568, 165 p.
Rich, J.L., 1935, Glacial geology of the Catskills: New York State Museum Bulletin 299, 180 p.
Stoddard, J.L., and Murdoch, P.A., 1991, Catskill Mountains, in Charles, D.F., ed., Acidic deposition and aquatic ecosystems-Regional case studies: New York, Springer-Verlag, p. 237-272.
Tornes, L.A., 1979, Soil survey of Ulster County, New York: U.S. Department of Agriculture Soil Conservation Service, 273 p.
U.S. Geological Survey, published annually, Water resources data, New York, Albany: U.S. Geological Survey Water Data Report.
a. U.S. Geological Survey topographic maps:
b. Geologic maps:
c. Soil surveys:
d. Other maps:
Table B-1. NWIS site identification numbers and site names for water-quality sampling sites.
| Site | Identification Number | Site Name |
| 1 | 01362198 | ESOPUS CREEK AT SHANDAKEN, NEW YORK |
| 2 | 420723074240200 | BUSHNELLSVILLE CREEK NEAR SHANDAKEN, NEW YORK |
| 3 | 420618074265400 | BIRCH CREEK NEAR BIG INDIAN, NEW YORK |
| 4 | 420656074271200 | ROCHESTER HOLLOW CREEK NEAR BIG INDIAN, NEW YORK |
| 5 | 420912074274400 | BIRCH CREEK AT PINE HILL, NEW YORK |
| 6 | 420459074265600 | HATCHERY HOLLOW CR NR BIG INDIAN, NEW YORK |
| 7 | 420551074265800 | ESOPUS CR BELOW OLIVEREA, NEW YORK |
| 8 | 420414074282900 | MCKENLEY HOLLOW CR NR OLIVEREA, NEW YORK |
| 9 | 420317074272700 | ESOPUS CR AB OLIVEREA, NEW YORK |
| 10 | 420200074251400 | GIANT LEDGE CR NR OLIVEREA, NEW YORK |
| 11 | 420057074244600 | TRIBUTARY BLW WINNISOOK LK NR OLIVEREA, NEW YORK |
| Back to 1173-A Contents |
This page maintained by Nichole Bisceglia.
Last updated July 31, 2000.