
Hydrologic Benchmark Network Stations in the Midwestern U.S. 1963-95 (USGS Circular 1173-B)
|
|
|
|
|
Kawishiwi River near Ely, Minnesota (Station 05124480)
To download a printer friendly PDF version of this information click here.
This report details one of the approximately 50 stations in the Hydrologic Benchmark Network (HBN) described in the four-volume U.S. Geological Survey Circular 1173. The suggested citation for the information on this page is:
|
Mast, M.A., and Turk, J.T., 1999, Environmental characteristics and water quality of Hydrologic Benchmark Network stations in the Midwestern United States, 1963-95: U.S. Geological Survey Circular 1173-B, 130 p. |
All of the tables and figures are numbered as they appear in each circular. Use the navigation bar above to view the abstract, introduction and methods for the entire circular, as well as a map and list of all of the HBN sites. Use the table of contents below to view the information on this particular station.
|
Table of Contents |
| 1. Site Characteristics and Land Use |
| 2. Historical Water Quality Data and Time-Series Trends |
| 3. Synoptic Water Quality Data |
Site Characteristics and Land Use
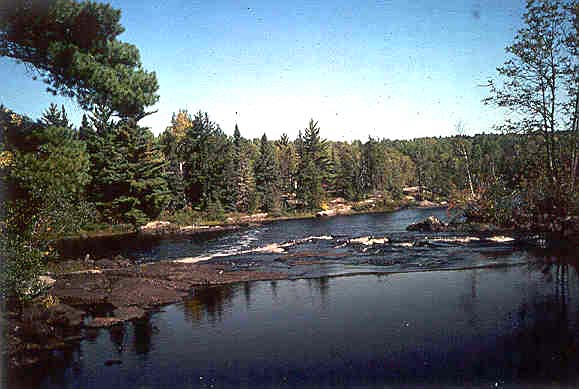 |
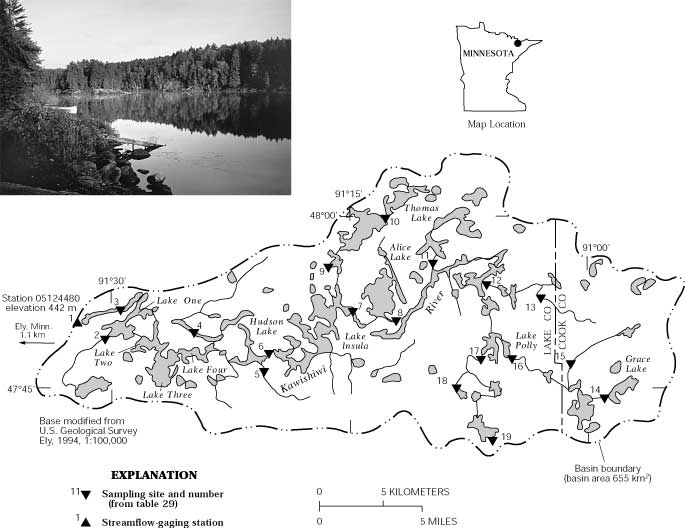
The Kawishiwi River HBN Basin is in the Superior Upland physiographic province in the northeastern corner of Minnesota (Figure 14. Map showing study area in the Kawishiwi River Basin and photograph of a typical lake in the basin). The 655-km² basin ranges in elevation from 442 to 643 m and drains an area of rolling bedrock ridges interspersed with irregular shallow basins occupied by hundreds of lakes and peatlands (Heinselman, 1996). The USGS gaging station is located 22.5 km east of the town of Ely, Minn., at latitude 47×55'22'' and longitude 91×32'06''. The Kawishiwi River flows west into the Basswood River, a tributary of the Rainy River, and has an average stream gradient of 1.4 m/km and a channel length upstream from the gaging station of about 77 km, of which about 40 percent consists of on-channel lakes (Siegel and Ericson, 1980). The main channel is perennial, and discharge is strongly seasonal with mean monthly flows that range from 1.6 m³/s in March under ice cover to 18.6 m³/s in May during spring breakup and snowmelt. Average annual runoff from the basin was 28 cm from 1966 through 1995 (Mitton and others, 1996). The climate is classified as continental with short summers and long, cold winters. Average monthly air temperatures range from -14.4×C in January to 19.2×C in July (National Climatic Data Center, 1996). Average annual precipitation is about 70 cm, of which about 40 percent falls as snow (Pettyman, 1978). In most winters, permanent ice cover is established on almost all lakes and streams, and a seasonal snowpack covers the basin from about mid-November to mid-April.
The Kawishiwi River Basin is in the Laurentian Mixed Forest ecoregion (Bailey and others, 1994), and vegetation is representative of the extreme southern part of the boreal forest zone (Pettyman, 1978). The upland areas are dominated by jack pine, quaking aspen, and birch and commonly have an understory of northern red oak, black spruce, or fir. Shrubs common in the upland forests include juneberry, beaked hazel, mountain maple, willow, and American green alder. The once common red and white pine species are only in isolated, scattered stands because of the past effects of logging and fire. In the wetter lowland areas and bogs, the predominant tree species are black spruce, northern white cedar, and tamarack; speckled alder is the common shrub. Most soils in the basin are mapped in the Mesaba-Barto-Mucky peats association (Pettyman, 1978). The Barto and Mesaba series include well-drained soils that formed in loamy glacial material and range in thickness from 20 to 100 cm. A typical soil profile has a thin surface layer of organic matter over a subsoil of gravelly, sandy loam that has an accumulation of organic matter and iron and aluminum oxides. These soils generally are acidic and have low cation-exchange capacities (<10 meq/100 g soil) and low base saturation (Cook and Jager, 1991). Mucky peats are poorly drained soils that form in bogs and lowland areas surrounding lakes and streams. These soils consist of dark-brown, partly decomposed organic materials extending to depths of 130 cm (Pettyman, 1978).
Bedrock in the basin belongs to the Duluth Complex of Proterozoic age, which consists of gabbroic and troctolitic anorthosites, which have been intruded by several types of mafic and felsic rocks. The anorthosites are composed mostly of calcic plagioclase (greater than 80 percent) and variable amounts of olivine, pyroxene, and iron oxide minerals (Davidson, 1969). Some anorthosites in the area have been weakly mineralized and contain small amounts of pyrite, chalcopyrite, and pyrrhotite (Davidson, 1969). Most bedrock in the basin is mantled by a thin layer of brown Wisconsin till, usually less than 5 m in thickness. The till is stony with a sandy matrix and contains cobbles and boulders consisting of mafic and felsic rock types (Grout and others, 1959). Topographic features in the basin trend northeast- southwest and reflect both structures in the Proterozoic bedrock and the general direction of glaciation (Siegel, 1981).
 |
The Kawishiwi River Basin drains parts of Lake and Cook Counties in Minnesota and is entirely within the boundaries of the Boundary Waters Canoe Area Wilderness (BWCAW). The BWCAW is part of the National Wilderness Preservation System and is administered by the Superior National Forest (U.S. Department of Agriculture, 1993). The interior of the basin is accessible by canoe from hundreds of portage-linked lakes and streams, although there are only three road-accessible launch points along the perimeter of the basin. The gaging station can be reached in summer by canoe from an access point about 2.4 km upstream. Most lakes and streams are ice covered during the winter, and the gaging station is accessible only by snowshoes or skis. A wilderness travel permit issued by the Forest Service is required for all overnight visits in the BWCAW from May 1 through September 30. Camping is permitted only at developed campsites, which have wilderness box latrines.
The history of land use and vegetation disturbance in the BWCAW is described in detail by Heinselman (1996). The forest ecosystem of the BWCAW was changed substantially by two periods of timber harvesting, the big-pine era from 1895 to 1930 and the pulpwood era from 1935 to 1978. During the big-pine era, as much as 70 percent of big white and red pines were harvested in BWCAW, and several major fires burned large areas of forest. The logging, in combination with slash fires, converted the former pine forests to paper birch and aspen stands that still persist today. The Superior National Forest was created in 1909 near the end of the big-pine era, and management efforts were initially focused on controlling fire, acquiring land, and improving timber stands. This improvement of forest resources, in combination with the development of a wood-pulp industry, resulted in the pulpwood era of logging that lasted from 1935 to 1978. During this second period of logging, large amounts of jack pine and black spruce were cut in the BWCAW, and an intense network of unpaved roads penetrated the area, including the southern and eastern parts of the Kawishiwi River Basin. In 1964, the BWCAW became part of the National Wilderness Preservation System, although logging, mining, and motorized travel still were permitted in the wilderness boundary. In 1978, the BWCAW Act finally ended logging and greatly decreased motorboat usage in the wilderness area. Since 1978, land use has been limited primarily to backcountry recreational use, and the BWCAW has become the most heavily used wilderness area in the United States. Visitor use has increased threefold since the early 1960's, and more than 100,000 people camp in the backcountry each year. The major visitor effects on the ecosystem are disturbance of vegetation and soils and degradation of water quality around established campsites. The most heavily used areas in the Kawishiwi River Basin are around Lake One, Lake Two, Lake Three, and Lake Insula (U.S. Department of Agriculture, 1993).
Historical Water-Quality Data and Time-Series Trends
The data set for the Kawishiwi River HBN Station analyzed for this report includes 132 water- quality samples that were collected from July 1966 through July 1995. Sampling frequency ranged from bimonthly to monthly from 1967 through 1970 and quarterly from 1971 through 1995. Additional water- quality samples were collected at the HBN station in 1976 as part of an environmental impact study to evaluate the possible effects of mining on hydrologic systems in northeastern Minnesota (Siegel and Ericson, 1980). Samples that were collected in the early part of the period of record were analyzed at a USGS laboratory in Columbus, Ohio, that operated until 1973 (Durum, 1978). After establishment of the central laboratory system, samples were analyzed at a laboratory in Salt Lake City, Utah, from 1973 through 1975 and at the NWQL in Arvada, Colo., from 1976 through 1995. Daily discharge records for the Kawishiwi River (station 05124480) are available beginning in June 1966. Records of daily water temperatures at the gaging station are available from July 1966 through September 1981.
 |
Calculated ion balances for 127 samples with complete major-ion analyses are shown in Figures 15a and 15b. Temporal variation of discharge, field pH, major dissolved constituents, and ion balance at Kawishiwi River, Minnesota. Ion balances ranged from -27 to 19 percent, and over 30 percent of the samples had values outside the ±10 percent range. This large range of ion balances was not unexpected considering the difficulties in making precise analytical measurements at the low solute concentrations typical of this station. The average ion balance was 1.0 percent, and 60 percent of the samples had positive ion balances, indicating a slight excess of measured cations over anions in solution, perhaps reflecting the presence of unmeasured organic anions. Time-series plots of the major dissolved constituents were inspected for evidence of method-related effects (fig. 15). The most notable pattern observed was in sulfate, which showed a period of elevated concentrations during the late 1980's. This pattern coincides with the use of a turbidimetric titration for sulfate analyses at the NWQL in Arvada, Colo., between March 1986 and December 1989 (Fishman and others, 1994). In 1989, the NWQL determined that sulfate concentrations can be overestimated by this method and changed the method to ion chromatography in 1990 (Office of Water Quality Technical Memorandum No. 90.04, Turbidimetric Sulfate Method, issued December 21, 1989, at URL http://water.usgs.gov/admin/memo/, accessed 1997). The bias was most pronounced in dilute water, although it was not consistent among the samples and seemed to be affected by factors such as color and turbidity (Schertz and others, 1994). The positive bias in sulfate concentrations also is reflected in the ion balances, which were consistently negative between 1986 and 1989. In addition to sulfate, elevated concentrations of calcium and chloride were evident in a number of samples that were collected in the mid-1970's. The cause of these high concentrations could not be determined; however, the samples were collected during the period when chemical analyses were conducted at the central laboratory in Salt Lake City, Utah.
Median concentrations and ranges of major constituents in stream water collected at the Kawishiwi River Station and VWM concentrations in wet-only deposition measured at the Fernberg NADP Station are listed in table 26. Precipitation chemistry at the NADP station, which is about 4 km northeast of the HBN station, was dilute and slightly acidic with a VWM pH of 5.0 for 16 years of record. The predominant cations in precipitation were ammonium, hydrogen, and calcium, which contributed 38, 27, and 22 percent of the total cation charge, respectively. Sulfate and nitrate were the predominant anions, accounting for 55 and 39 percent of the total anion charge, respectively. The predominance of strong acid anions indicates that precipitation at the NADP station may be affected by anthropogenic emissions of sulfur and nitrogen compounds, which cause acid rain (Glass and Loucks, 1986).
Table 26. Minimum, first quartile, median, third quartile, and maximum values of physical properties and major dissolved constituents measured in water-quality samples from Kawishiwi River, Minnesota, July 1966 through July 1995, and volume-weighted mean concentrations in wet precipitation collected at the Fernberg Station, Minnesota
[Concentrations in units of microequivalents per liter, discharge in cubic meters per second, specific conductance in microsiemens per centimeter at 25 degrees Celsius, and silica in micromoles per liter; n, number of stream samples; VWM, volume-weighted mean; inst., instantaneous; spec. cond., specific conductance; <, less than; --, not reported]
|
Parameter |
Stream Water |
Precipitation VMAa |
|||||
|
Minimum |
First quartile |
Median |
Third quartile |
Maximum |
n |
||
|
Discharge, inst. |
0.12 |
1.95 |
3.23 |
9.11 |
44 |
133 |
-- |
|
Spec. cond., field |
19 |
29 |
31 |
35 |
50 |
133 |
9.2 |
|
pH, field |
6.0 |
6.7 |
7.0 |
7.2 |
9.1 |
135 |
5.0b |
|
Calcium |
120 |
150 |
160 |
175 |
290 |
134 |
8.2 |
|
Magnesium |
72 |
100 |
110 |
140 |
150 |
135 |
2.5 |
|
Sodium |
26 |
43 |
48 |
52 |
96 |
132 |
2.0 |
|
Potassium |
<2.6 |
7.7 |
10 |
10 |
26 |
132 |
.6 |
|
Ammonium |
<.7 |
1.4 |
1.4 |
2.1 |
26 |
60 |
14 |
|
Alkalinity, laboratory |
120 |
200 |
220 |
220 |
320 |
134 |
-- |
|
Sulfate |
25 |
63 |
90 |
120 |
310 |
134 |
21 |
|
Chloride |
<2.8 |
11 |
17 |
23 |
68 |
134 |
2.1 |
|
Nitrite plus nitrate |
<.7 |
3.6 |
6.4 |
7.1 |
21 |
99 |
15c |
|
Silica |
23 |
52 |
60 |
69 |
120 |
133 |
-- |
a Data are volume-weighted mean concentrations for 1980-95.
b Laboratory pH.
Stream water in the Kawishiwi River is dilute and weakly buffered; specific conductance ranged from 19 to 50 µmS/cm, and alkalinity was between 120 and 320 meq/L (table 26). The river also has brownish tea-colored water, which is characteristic of surface runoff from hundreds of wetlands in the basin (Heinselman, 1996). The major cations in stream water were calcium and magnesium, and bicarbonate was the predominant anion. The predominance of these solutes in stream water is attributed to the weathering of calcium-rich plagioclase and pyroxene minerals in the bedrock and till. The median concentration of chloride in stream water was 17 meq/L, which is about eight times greater than the VWM concentration of 2.1 meq/L in precipitation. On the basis of the difference between annual precipitation and runoff, evapotranspiration can account for no more than a threefold increase in the chloride concentration of precipitation, indicating that some stream-water chloride is derived from sources other than wet precipitation. Because there is no development in the basin, the only plausible source for additional stream- water chloride is weathering of mafic minerals in the bedrock (Peters, 1991). The median concentration of sulfate in stream water was 90 meq/L compared to 21 meq/L in precipitation, which is slightly larger than would be expected solely from the effects of evapotranspiration. Assuming that geologic sources are minor, most of the additional stream-water sulfate probably is derived from dry deposition from the atmosphere. Baker (1991) estimated that dry deposition was about 27 percent of total sulfate deposition in the region, which seems to be consistent with sulfate concentrations in the river. Concentrations of inorganic nitrogen species in stream water were less than the concentrations in precipitation, indicating most atmospheric nitrogen is retained by vegetation and soils in the basin.
The solute composition of stream water was further evaluated by analyzing correlations between solutes and stream discharge (table 27). The major dissolved constituents were poorly correlated with discharge, except for weak inverse correlations with calcium (rho = -0.444) and magnesium (rho = -0.447). Although discharge in the Kawishiwi River is strongly seasonal, the lack of correlation with solutes probably reflects streamflow that is mostly derived from a well-mixed reservoir of water stored in on-channel lakes. Among the solutes, the strongest correlations were between calcium and magnesium (rho = 0.629) and calcium and sodium (rho = 0.526), which may reflect common mineralogic sources for these solutes. The most abundant mineralogic source of calcium and magnesium is pyroxene in the mafic rocks, whereas plagioclase is the only common weathering source of both calcium and sodium.
Table 27. Spearman rank correlation coefficients (rho values) showing the relation among discharge, pH, and major dissolved constituents, Kawishiwi River, Minnesota, 1966-95
[Q, discharge; Ca, calcium; Mg, magnesium; Na, sodium; K, potassium; Alk, alkalinity; SO4, sulfate; Cl, chloride; Si, silica]
|
|
Q |
pH |
Ca |
Mg |
Na |
K |
Alk |
SO4 |
Cl |
| pH |
-0.087 |
|
|
|
|
|
|
|
|
| Ca |
-.444 |
-0.157 |
|
|
|
|
|
|
|
| Mg |
-.447 |
-.153 |
0.629 |
|
|
|
|
|
|
| Na |
-.357 |
-.133 |
.526 |
0.489 |
|
|
|
|
|
| K |
-.128 |
.025 |
.282 |
.159 |
-0.020 |
|
|
|
|
| Alk |
-.157 |
.049 |
.298 |
.389 |
.185 |
-0.100 |
|
|
|
| SO4 |
.041 |
.072 |
.188 |
.126 |
.138 |
.271 |
-0.177 |
|
|
| Cl |
-.073 |
-.019 |
.181 |
.246 |
.135 |
.133 |
-.129 |
0.484 |
|
| Si |
.351 |
-.333 |
.139 |
.043 |
.128 |
-.028 |
-.224 |
.224 |
0.344 |
Results of the seasonal Kendall test for trends in discharge and major dissolved constituents are listed in table 28. Statistically significant downward trends were detected in the unadjusted calcium, sulfate, chloride, and silica concentrations at the 0.01 probability level. Trends in flow-adjusted concentrations were not calculated for calcium, sulfate, and chloride because the flow models were not statistically significant at
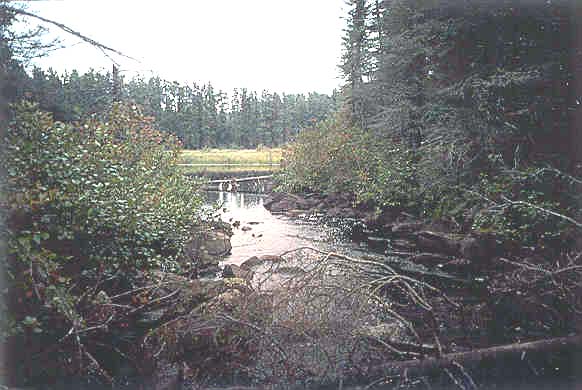 |
Table 28. Results of the seasonal Kendall test for trends in discharge and unadjusted and flow-adjusted pH and major dissolved constituents, Kawishiwi River, Minnesota, July 1966 through July 1995
[Trends in units of microequivalents per liter per year, except discharge in cubic meters per second per year, pH in standard units per year, and silica in micromoles per liter per year; inst., instantaneous; <, less than; --, not calculated]
|
Parameter |
Unadjusted |
Flow adjusted |
||
|
Trend |
p-value |
Trend |
p-value |
|
| Discharge, inst. |
-0.02 |
0.292 |
-- |
-- |
| pH, field |
<.01 |
.341 |
<0.01 |
0.315 |
| Calcium |
-.7 |
.000 |
(a) |
-- |
| Magnesium |
<.1 |
.669 |
<.1 |
.789 |
| Sodium |
<.1 |
.063 |
-.2 |
.047 |
| Potassium |
<.1 |
.001 |
<.1 |
.001 |
| Alkalinity, laboratory |
<.1 |
.087 |
.2 |
.198 |
| Sulfate |
-2.4 |
.000 |
(a) |
-- |
| Chloride |
-.4 |
.001 |
(a) |
-- |
| Nitrite plus nitrate |
.1b |
.064 |
(a) |
-- |
| Silica |
-.4 |
.002 |
-.4 |
.003 |
a Flow model not significant at a = 0.10.
b Trend calculated for 1971—95 using a trend test for censored data.
Synoptic Water-Quality Data
Results of the surface-water synoptic sampling in the Kawishiwi River Basin on September 11-14, 1992, are listed in table 29, and the locations of the sampling sites are shown in figure 14. During the sampling period, discharge at the gaging station was about 3.1 m³/s compared to the median daily discharge of 2.0 m³/s for September (Lawrence, 1987), indicating that the basin was sampled during higher than normal flow conditions for that time of year. Solute concentrations measured at site 1 were less than the first- quartile concentrations reported for the HBN station during the entire period of record (table 26), except for calcium and silica concentrations, which were higher. Stream water at all the upstream sampling sites was very dilute and similar in composition to stream water collected at the gaging station (site 1); calcium was the predominant cation, and bicarbonate was the predominant anion. Although not measured, dissolved organic carbon seemed to be an important component of stream water based on the tealike color of the water and the large positive ion balances of the synoptic samples (range 6.6 to 55 percent). The most notable spatial pattern in stream chemistry was that concentrations of the weathering-derived cations varied by less than a factor of two, whereas alkalinity varied by almost a factor of eight. For example, calcium concentrations ranged from 110 to 210 meq/L compared to alkalinity, which ranged from 49 to 400 meq/L (table 29). Dissolved organic carbon seemed to be related to the variation in alkalinity, as evidenced by the strong inverse correlation between alkalinity and ion balance (rho = -0.820), indicating that organic ligands may be important in controlling the acid-base status of surface water in the basin. Chloride and nitrate were uniformly low throughout the basin; chloride concentrations ranged from 2.5 to 8.7 meq/L, and nitrate concentrations varied from 0.4 to 2.5 meq/L. These results are consistent with the low concentrations of these constituents in precipitation and with the minimal amount of human activity in the basin. Sulfate concentrations ranged from 16 to 77 meq/L, which is slightly more than might be expected from variations in atmospheric deposition. These results may indicate that biological processes are important in controlling stream chemistry, particularly in wetland areas where reducing conditions in the soils may remove sulfate from the surface- water system. Silica concentrations varied from 32 to 150 mmol/L and were not correlated with patterns in the other weathering-derived constituents. As with sulfate, this pattern may be related to biological processes, such as the removal of silica by diatoms in the large number of lakes in the basin.
Table 29. Physical properties and major dissolved constituents from surface-water sampling sites in the Kawishiwi River Basin, Minnesota, collected September 11-14, 1992
[Site locations shown in fig. 14; Q, discharge in cubic meters per second; SC, specific conductance in microsiemens per centimeter at 25 degrees Celsius; pH in standard units; Ca, calcium; Mg, magnesium; Na, sodium; K, potassium; Alk, alkalinity; SO4, sulfate; Cl, chloride; NO3, nitrate; Si, silica; concentrations in microequivalents per liter, except silica in micromoles per liter; --, not reported]
|
Site |
Station number |
Q |
SC |
pH |
Ca |
Mg |
Na |
K |
Alk |
SO4 |
Cl |
NO3 |
Si |
Remarks |
|
1 |
05124480 |
3.1 |
30 |
7.0 |
160 |
100 |
39 |
7.9 |
150 |
54 |
6.2 |
1.1 |
70 |
Gaging station |
|
2 |
475436091303600 |
-- |
33 |
6.3 |
180 |
170 |
48 |
8.5 |
150 |
31 |
8.7 |
1.6 |
110 |
Downstream from boat access |
|
3 |
475558091292100 |
.23 |
30 |
6.9 |
170 |
96 |
39 |
7.9 |
180 |
50 |
7.3 |
0.4 |
63 |
Lake outflow |
|
4 |
475504091250500 |
.12 |
35 |
6.8 |
160 |
180 |
43 |
3.6 |
200 |
50 |
5.4 |
2.5 |
65 |
Lake outflow |
|
5 |
475303091203300 |
.11 |
49 |
6.7 |
210 |
280 |
48 |
3.8 |
400 |
27 |
4.8 |
0.4 |
110 |
No lakes in subbasin |
|
6 |
475357091200100 |
2.0 |
29 |
7.0 |
160 |
88 |
43 |
6.2 |
190 |
50 |
6.2 |
0.7 |
67 |
Lake outflow |
|
7 |
475550091144500 |
1.9 |
28 |
7.0 |
160 |
80 |
43 |
5.9 |
170 |
50 |
5.6 |
1.5 |
65 |
Lake outflow, gabbroic bedrock |
|
8 |
475527091122000 |
3.3 |
27 |
6.8 |
160 |
76 |
39 |
6.2 |
160 |
44 |
4.5 |
1.1 |
50 |
Lake outflow, gabbroic bedrock |
|
9 |
475730091161800 |
.0082 |
35 |
6.8 |
160 |
150 |
39 |
5.9 |
240 |
58 |
5.9 |
0.5 |
43 |
Lake outflow |
|
10 |
475946091124600 |
.19 |
34 |
7.1 |
190 |
100 |
43 |
7.2 |
210 |
77 |
7.3 |
0.6 |
60 |
Lake outflow, greenstone |
|
11 |
475800091094600 |
.14 |
32 |
6.9 |
180 |
96 |
43 |
4.9 |
220 |
48 |
5.4 |
0.6 |
38 |
Lake outflow |
|
12 |
475702091064900 |
-- |
25 |
6.7 |
170 |
75 |
35 |
4.4 |
96 |
27 |
4.5 |
1.0 |
70 |
Main tributary |
|
13 |
475620091025900 |
.30 |
21 |
6.6 |
140 |
59 |
35 |
2.6 |
82 |
29 |
3.7 |
1.1 |
120 |
Intermediate volcanic rocks |
|
14 |
475210090585500 |
.61 |
20 |
6.6 |
110 |
55 |
30 |
4.9 |
89 |
48 |
3.7 |
0.8 |
88 |
Lake outflow, granitic bedrock |
|
15 |
475256091013200 |
-- |
21 |
5.9 |
140 |
65 |
35 |
2.1 |
49 |
16 |
3.7 |
1.0 |
150 |
Intermediate volcanic rocks |
|
16 |
475355091050900 |
1.6 |
23 |
6.5 |
150 |
72 |
39 |
5.1 |
110 |
33 |
4.5 |
2.1 |
82 |
Main tributary |
|
17 |
475344091065700 |
.65 |
24 |
6.6 |
150 |
69 |
43 |
3.6 |
110 |
35 |
3.7 |
0.8 |
72 |
Main tributary |
|
18 |
475228091080500 |
.047 |
23 |
6.6 |
140 |
58 |
35 |
5.6 |
100 |
29 |
3.7 |
1.5 |
32 |
Lake outflow, gabbroic bedrock |
|
19 |
474206091061500 |
-- |
30 |
7.0 |
160 |
100 |
39 |
2.6 |
150 |
54 |
6.2 |
1.1 |
70 |
Gabbroic bedrock |
References Cited
Bailey, R.G., Avers, P.E., King, T., and McNab, W.H., eds., 1994, Ecoregions and subregions of the United States with supplementary table of map unit descriptions: Washington, D.C., U.S. Department of Agriculture Forest Service, scale 1:7,500,000(also at URL http://www.fs.fed.us/land/ecosysmgmt/ecoreg1_home.html, accessed 1998).
Baker, L.A., 1991, Regional estimates of atmospheric dry deposition, in Charles, D.F., ed., Acidic deposition and aquatic ecosystems-Regional case studies: New York, Springer-Verlag, p. 645-652.
Cook, R.B., and Jager, H.I., 1991, Upper Midwest, in Charles, D.F., ed., Acidic deposition and aquatic ecosystems-Regional case studies: New York, Springer-Verlag, p. 421-466.
Davidson, D.M., Jr., 1969, Geologic map of Kawishiwi Lake quadrangle, Lake and Cook Counties, Minnesota: Minnesota Geological Survey Miscellaneous Map M-7, 10 p.
Durum, W.H., 1978, Historical profile of quality of water laboratories and activities, 1879-1973: U.S. Geological Survey Open-File Report 78-432, 235 p.
Fishman, M.J., Raese, J.W., Gerlitz, C.N., and Husband, R.A., 1994, U.S. Geological Survey approved inorganic and organic methods for the analysis of water and fluvial sediment, 1954-94: U.S. Geological Survey Open-File Report 94-351, 55 p.
Glass, G.E., and Loucks, O.L., 1986, Implications of a gradient in acid and ion deposition across the northern lakes states: Environmental Science and Technology, v. 20, p. 35-43.
Grout, F.F., Sharp, R.P., and Schwartz, G.M., 1959, The geology of Cook County, Minnesota: Minnesota Geological Survey Bulletin 39, 163 p.
Heinselman, Miron, 1996, The boundary waters wilderness ecosystem: Minneapolis and London, University of Minnesota Press, 334 p.
Lawrence, C.L., 1987, Streamflow characteristics at hydrologic benchmark stations: U.S. Geological Survey Circular 941, 123 p.
Mitton, G.B., Wakeman, E.S., and Guttormson, K.G., 1996, Water resources data, Minnesota, water year 1995: U.S. Geological Survey Water-Data Report MN-95-1, 389 p.
National Climatic Data Center, 1996, Summary of the day: Boulder, Colorado, EarthInfo Incorporated, CD-ROM.
Peters, N.E., 1991, Chloride cycling in two forested lake watersheds in the west-central Adirondack Mountains, New York, U.S.A.: Water, Air, and Soil Pollution, v. 59, p. 201-215.
Pettyman, D.H., 1978, Soil survey of Kawishiwi area, Minnesota-Parts of Lake and Cook Counties in Superior National Forest: U.S. Department of Agriculture Soil Conservation Service, 35 p.
Schertz, T.L., Wells, F.C., and Ohe, D.J., 1994, Sources of trends in water-quality data for selected streams in Texas, 1975-89 water years: U.S. Geological Survey Water-Resources Investigations Report 94-4213, 49 p.
Siegel, D.I., and Ericson, D.W., 1980, Hydrology and water quality of the copper-nickel study region, northeastern Minnesota: U.S. Geological Survey Water-Resources Investigations Report 80-739, 87 p.
Siegel, D.I., 1981, Effect of snowmelt on the quality of Filson Creek and Omaday Lake, northeastern Minnesota: U.S. Geological Survey Water-Resources Investigations Report 81-66, 81 p.
U.S. Department of Agriculture, 1993, Final environmental impact statement for the BWCA wilderness management plan and implementation schedule: Forest Service, Eastern Region, Superior National Forest.
Appendix A. List of Map References
a. U.S. Geological Survey topographic maps:
- Alice Lake, Minnesota (1:24,000), 1986
- Beth Lake, Minnesota (1:24,000), 1986
- Gabbro Lake, Minnesota (1:24,000), 1986
- Kawishiwi Lake, Minnesota (1:24,000), 1986
- Isabella Lake, Minnesota (1:24,000), 1986
- Kekekabic Lake, Minnesota (1:24,000), 1986
- Kelso Mountain, Minnesota (1:24,000), 1986
- Lake Insula, Minnesota (1:24,000), 1986
- Lake Polly, Minnesota (1:24,000), 1986
- Ogishkemuncie Lake, Minnesota (1:24,000), 1986
- Ojibway Lake, Minnesota (1:24,000), 1986, gaging station on this quadrangle
- Perent Lake, Minnesota (1:24,000), 1986
- Quadga Lake, Minnesota (1:24000), 1986
- Snowbank Lake, Minnesota (1:24,000), 1986
- Basswood Lake, Minnesota (1:100,000), 1978
- Ely, Minnesota (1:100,000), 1978
b. Geologic maps:
- Davidson, D.M., Jr., 1969, Geologic map of Kawishiwi Lake quadrangle, Lake and Cook Counties, Minnesota: Minnesota Geological Survey Miscellaneous Map M-7, scale 1:24,000.
- Davidson, D.M., Jr., 1969, Geologic map of Perent Lake quadrangle, Lake County, Minnesota: Minnesota Geological Survey Miscellaneous Map M-8, scale 1:24,000.
- Davidson, D.M., Jr., 1977, Reconnaissance geologic map of Alice Lake quadrangle, Cook County, Minnesota: Minnesota Geological Survey Miscellaneous Map M-33, scale 1:24,000.
- Davidson, D.M., Jr., 1977, Reconnaissance geologic map of Beth Lake quadrangle, Cook County, Minnesota: Minnesota Geological Survey Miscellaneous Map M-26, scale 1:24,000.
- Davidson, D.M., Jr., 1977, Reconnaissance geologic map of Kelso Mountain quadrangle, Cook County, Minnesota: Minnesota Geological Survey Miscellaneous Map M-27, scale 1:24,000.
- Davidson, D.M., Jr., 1977, Reconnaissance geologic map of Lake Polly quadrangle, Cook County, Minnesota: Minnesota Geological Survey Miscellaneous Map M-34, scale 1:24,000.
- Green, J.C., 1982, Bedrock geology, Two Harbors sheet, Minnesota: Minnesota Geological Survey, scale 1:250,000.
c. Soil surveys:
- Pettyman, D.H., 1978, Soil survey of Kawishiwi area, Minnesota—Parts of Lake and Cook Counties in Superior National Forest: U.S. Department of Agriculture Soil Conservation Service, 35 p.
d. Miscellaneous maps:
- U.S. Department of Agriculture, 1987, Map of BWCA wilderness entry points: Washington, D.C., U.S. Department of Agriculture Forest Service, 22 ¥ 35
- U.S. Department of Agriculture, 1976, Map of the boundary waters canoe area—Superior National Forest, Minnesota: Washington, D.C., U.S. Department of Agriculture Forest Service, 28 ¥ 39 cm
- U.S. Department of Agriculture, 1994, Superior National Forest, Minnesota: Milwaukee, Wisconsin, U.S. Department of Agriculture Forest Service, Eastern Region, scale 1:253,000.