
Hydrologic Benchmark Network Stations in the Midwestern U.S. 1963-95 (USGS Circular 1173-B)
|
|
|
|
|
North Fork Whitewater River near Elba, Minnesota (Station 05376000)
To download a printer friendly PDF version of this information click here.
This report details one of the approximately 50 stations in the Hydrologic Benchmark Network (HBN) described in the four-volume U.S. Geological Survey Circular 1173. The suggested citation for the information on this page is:
|
Mast, M.A., and Turk, J.T., 1999, Environmental characteristics and water quality of Hydrologic Benchmark Network stations in the Midwestern United States, 1963-95: U.S. Geological Survey Circular 1173-B, 130 p. |
All of the tables and figures are numbered as they appear in each circular. Use the navigation bar above to view the abstract, introduction and methods for the entire circular, as well as a map and list of all of the HBN sites. Use the table of contents below to view the information on this particular station.
|
Table of Contents |
| 1. Site Characteristics and Land Use |
| 2. Historical Water Quality Data and Time-Series Trends |
| 3. Synoptic Water Quality Data |
Site Characteristics and Land Use
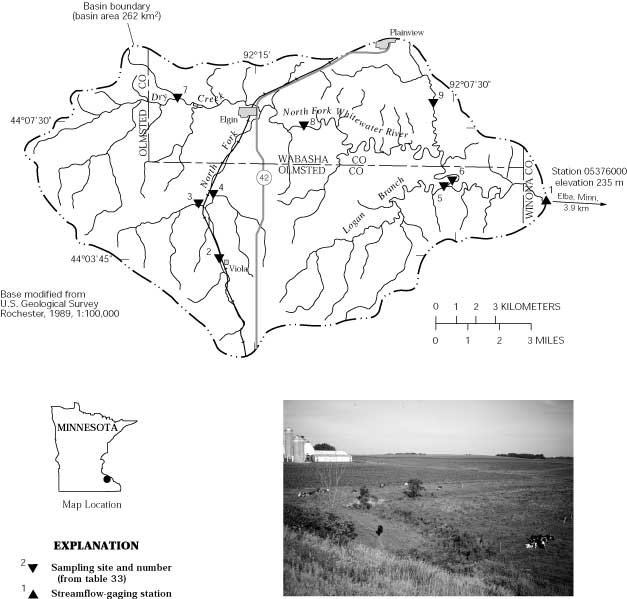
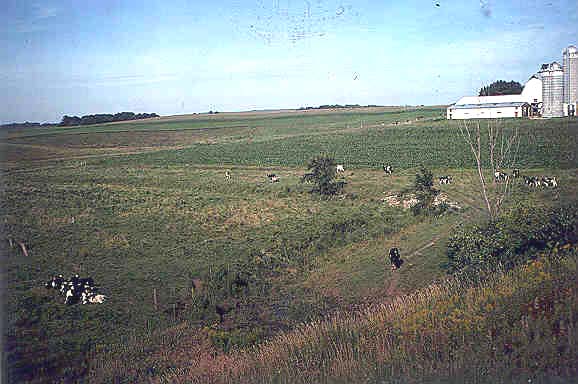
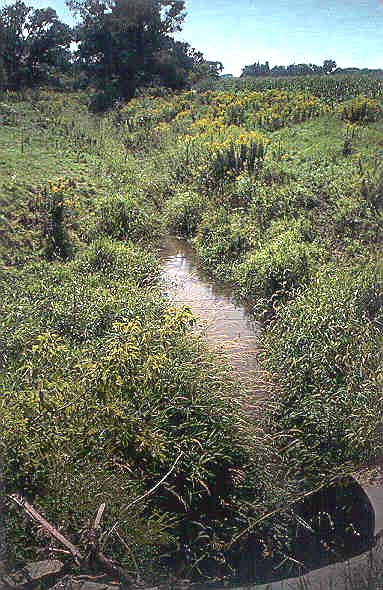
The North Fork Whitewater River HBN Basin is located in the Wisconsin Driftless Section of the Central Lowland physiographic province in the southeastern corner of Minnesota (Figure 16. Map showing study area in the North Fork Whitewater River Basin and photograph of agricultural land). The basin drains an area of 262 km² and ranges in elevation from 235 to 400 m. The gently rolling landscape in the upper part of the basin is formed by a plateau of erosion- resistant rock. In the lower part of the basin, the plateau surface is strongly dissected by several steep-sided stream channels. The USGS gaging station is located 3.9 km west of Elba, Minn., at latitude 44×05'30'' and longitude 92×03'57''. The North Fork Whitewater River drains east into the Whitewater River, a tributary of the Mississippi River, and has a channel length of 47 km upstream from the gaging station and an average stream gradient of 1.9 m/km. Mean monthly discharge varies over a narrow range from 0.86 m³/s in January to 2.5 m³/s in March, and average annual runoff from the basin was 17 cm from 1933 through 1995 (Mitton and others, 1996). The climate is characterized by moderately warm summers and cold winters. Average daily air temperatures range from -10.7×C in January to 22.7×C in July (Lueth, 1994). Precipitation averages 84 cm annually and more than 70 percent falls from April through September. The average seasonal snowfall is 120 cm and, on average, 95 days of the year have at least 2 cm of snow cover (Lueth, 1994).
 |
The North Fork Whitewater River Basin is in the Eastern Broadleaf Forest (Continental) ecoregion (Bailey and others, 1994), but only 16 percent of the basin is forested. Most forested areas are localized along the steep-sided slopes of the drainages in the lower part of the basin. Oak, shagbark hickory, bitternut hickory, aspen, and paper birch are the most common species. Large areas of the uplands at one time were covered by white oak, red oak, elm, basswood, maple, wild cherry, and pine that since have been cleared for farming. Soils in the basin are classified as Alfisols and mapped in the Seaton-NewGlarus-Palsgrove and Lacrescent-Lamoille soil associations (Lueth, 1994). The Seaton-NewGlarus-Palsgrove soils are well-drained silt loams developed in loess on the upland areas of the basin. A typical soil profile has a surface layer of grayish-brown silt loam that is 20 cm thick overlying a subsoil of dark yellowish-brown silt loam that extends to a depth of 150 cm. The soils generally have pH values between 5.1 and 7.3 and an organic-matter content of less than 3 percent in the upper 20 cm (McCleary and others, 1989). Soils in the Lacrescent-Lamoille series develop in loess and colluvium on steep-sided slopes along the drainages and consist of well-drained silt loams that contain between 20 and 60 percent cobbles and gravel.
Bedrock in the basin consists of gently dipping marine sedimentary rocks of Paleozoic age. The uplands plateau surface is capped by the resistant limestones of the Galena Formation and dolomite beds belonging to the Prairie du Chien Group of Paleozoic age (Mossler and Book, 1984). The softer shales and sandstones of the Decorah Shale, Platteville Formation, Glenwood Formation, St. Peter Sandstone, and Jordan Sandstone of Paleozoic age primarily crop out along the walls of the stream valleys (Mossler and Book, 1984). The Prairie du Chien Group and the Jordan Sandstone form the Prairie du Chien aquifer, which is the major water supply in the southeastern corner of Minnesota (Smith and Nemetz, 1996). The bedrock, particularly in the upland areas of the basin, is covered by till deposits of Pleistocene age. The till consists of a mixture of sand, silt, and clay that is calcareous where unweathered. A thin layer of loess mantles the till and the bedrock and ranges in thickness to as much as 3 m (Hobbs, 1988). The loess consists of a brownish silt loam that is leached of carbonate to a depth of 2 to 3 m. The steep walls along the stream channels are mantled by unsorted colluvium consisting of clasts of bedrock in a silt matrix derived from loess (Hobbs, 1984).
The North Fork Whitewater River Basin drains parts of Wabasha, Olmsted, and Winona Counties of Minnesota. Land ownership is 94 percent private and 6 percent State (W. Lorenzen, U.S. Department of Agriculture Natural Resources Conservation Service, written commun., 1996). Most State-owned land is part of the Whitewater State Forest and is located along a deeply incised section of the main channel of the North Fork Whitewater River in the lower part of the basin. More than 100 km of State and county roads traverse most areas of the basin. The incised section of the main river channel is accessible by hiking trails on State forest land; access to most tributaries is limited to rights-of-way at public road crossings. Many roads in the basin are plowed and heavily salted in winter.
 |
Land cover in the basin is 64 percent cropland, 8 percent pasture land, 16 percent forest, 6 percent wetland, and 6 percent residential and urban land (W. Lorenzen, written commun., 1996). Feed grain and forage for dairy cattle and other livestock are the major farming enterprises in the watershed. Recent trends in the farm economy have shown a shift from dairy operations to cash crop production, including cannery crops (U.S. Department of Agriculture, 1996). The average farm is 254 acres in size, and approximately one-third of farms are dairies. Other human-related features in the basin include the townships of Viola (population 604), Elgin (population 761), and part of Plainview (population 2,768); a wastewater-treatment plant at Plainview; a State park campground; and a railroad line that parallels the upper reach of the main river channel. Controlling erosion from croplands is the principal land- management concern in the region (Argabright and others, 1996). Implementation of conservation practices, such as terracing, strip cropping, and reducing tillage, caused a reduction in soil erosion rates in the region of nearly 50 percent between 1930 and 1992 (Argabright and others, 1996). The U.S. Department of Agriculture instituted the CRP in 1985 as an additional means of reducing soil erosion from highly erodible croplands. Under the program, farmers were paid in exchange for planting permanent vegetation types, such as sod-forming grasses and legumes. About 25 percent of cropland in the basin was planted in grasses under the CRP program; however, as much as 50 percent of that grass cover has come back into production since 1996 (W. Lorenzen, written commun., 1996). In 1996, a long-term watershed implementation plan was adopted for the drainage basin of the Whitewater River, of which the North Fork Whitewater River is one of four major tributaries (U.S. Department of Agriculture, 1996). The goal of the plan is to improve water quality, reduce sedimentation and flooding, and improve wildlife habitat in the Whitewater River Basin by developing a partnership among watershed citizens, governmental agencies, environmental groups, and businesses.
Historical Water-Quality Data and Time-Series Trends
The data set for the North Fork Whitewater River HBN Station analyzed for this report includes 218 water-quality samples that were collected from August 1967 through September 1993. Sampling frequency ranged from 8 to 12 samples per year during the period 1968 through 1982 and bimonthly from 1983 through 1993. Water-quality samples in the early part of the period of record were probably analyzed at a USGS laboratory in Columbus, Ohio, that operated until 1973 (Durum, 1978). After establishment of the central laboratory system, samples were analyzed at a laboratory in Salt Lake City, Utah, from 1973 through 1975 and at the NWQL in Arvada, Colo., from 1976 through 1995. Daily discharge records are available for the North Fork Whitewater River (station 05376000) from May 1939 through September 1941 and from July 1967 through September 1993.
Calculated ion balances for 210 samples with complete major-ion analyses are shown in Figures 17a and 17b. Temporal variation of discharge, field pH, major dissolved constituents, and ion balance at North Fork Whitewater River, Minnesota. Ion balances ranged from -16 to 20 percent, and more than 98 percent of samples had values in the ±10 percent range, indicating that the analytical measurements were of high quality. The average ion balance for all samples was slightly positive (1.2 percent), which probably is due to the fact that nitrite plus nitrate was
 |
Median concentrations and ranges of major constituents in stream water at the North Fork Whitewater River Station and VWM concentrations in wet-only deposition measured at the Wildcat Mountain NADP station are listed in table 30. Precipitation chemistry at the NADP station, which is about 120 km east of the HBN station, was dilute and slightly acidic with a VWM pH of 4.8 for 6 years of record. The predominant cations were ammonium, which contributed 45 percent of the total cation charge, and calcium and hydrogen, which accounted for 26 and 20 percent, respectively. Sulfate accounted for 56 percent of the total anions and nitrate contributed 39 percent. The predominance of strong acid anions at this site indicates that precipitation may be affected by anthropogenic emissions of sulfur and nitrogen compounds, which cause acid rain. In addition, the relatively high ammonium concentrations at this NADP station may be linked to the high density of livestock in this region of the country.
Table 30. Minimum, first quartile, median, third quartile, and maximum values of physical properties and major dissolved constituents measured in water-quality samples from North Fork Whitewater River, Minnesota, August 1967 through September 1993, and volume-weighted mean concentrations in wet precipitation collected at the Wildcat Mountain Station, Wisconsin
[Concentrations in units of microequivalents per liter, discharge in cubic meters per second, specific conductance in microsiemens per centimeter at 25 degrees Celsius, pH in standard units, and silica in micromoles per liter; n, number of stream samples; VWM, volume-weighted mean; inst., instantaneous; spec. cond., specific conductance; <, less than; --, not reported]
|
Parameter |
Stream Water |
Precipitation VWMa |
|||||
|
Minimum |
First quartile |
Median |
Third quartile |
Maximum |
n |
||
| Discharge, inst. |
0.37 |
0.70 |
1.0 |
1.4 |
71 |
219 |
-- |
| Spec. cond., field |
220 |
490 |
530 |
560 |
690 |
219 |
15 |
| pH, field |
7.2 |
8.0 |
8.2 |
8.3 |
9.1 |
216 |
4.8b |
| Calcium |
700 |
3,350 |
3,600 |
4,00 |
4,400 |
218 |
12 |
| Magnesium |
220 |
1,980 |
2,060 |
2,140 |
2,320 |
218 |
3.1 |
| Sodium |
70 |
200 |
230 |
290 |
570 |
218 |
2.2 |
| Potassium |
<2.6 |
36 |
44 |
59 |
280 |
215 |
.6 |
| Ammonium |
<.7 |
1.1 |
2.1 |
3.9 |
130 |
78 |
27 |
| Alkalinity, laboratory |
1,240 |
4,880 |
5,180 |
5,40 |
5,700 |
217 |
-- |
| Sulfate |
17 |
310 |
350 |
370 |
500 |
218 |
33 |
| Chloride |
28 |
170 |
240 |
340 |
650 |
219 |
2.5 |
| Nitrite plus nitrate |
<7.1 |
150 |
210 |
280 |
460 |
177 |
23c |
| Silica |
13 |
220 |
230 |
270 |
320 |
218 |
-- |
a Data are volume-weighted mean concentrations for 1989-95.
b Laboratory pH.
c Nitrate only.
 |
Stream water in the North Fork Whitewater River is concentrated and strongly buffered; specific conductance ranged from 200 to 690 mS/cm, and alkalinity was between 1,240 and 5,700 meq/L (table 22). Calcium and magnesium were the predominant cations, and bicarbonate was the predominant anion. The predominance of these solutes in stream water is attributed to the presence of limestone bedrock and carbonate minerals in the overlying till and loess deposits. The median concentration of chloride in stream water was 240 meq/L, which is almost 100 times greater than the VWM concentration of 2.5 meq/L in precipitation. This large difference in concentration indicates that most stream-water chloride is derived from sources other than precipitation. Most stream-water chloride probably is derived from a combination of natural and human-related sources; however, road salt, sewage effluent, and fertilizer are probably the largest contributors. Sulfate concentrations also were much higher in stream water than in precipitation. The main source of sulfate, other than atmospheric deposition, probably is calcium sulfate minerals present in variable amounts in the limestone and shale bedrock. The median concentrations of nitrate and ammonium in stream water were 210 and 2.1 meq/L compared to 23 and 27 meq/L in precipitation, indicating that a substantial amount of inorganic nitrogen is exported from the basin. The most likely sources of stream-water nitrate in the basin include fertilizers, animal wastes, and wastewater effluent. The median stream-water nitrate concentration was similar to the concentration of 210 meq/L (3 mg/L), which is considered indicative of human-related pollution of ground water in southeastern Minnesota (Smith and Nemetz, 1995).
The solute composition of stream water was further evaluated by analyzing correlations between solutes and stream discharge (table 31). Discharge was poorly correlated with the major dissolved constituents, except for a weak positive correlation with nitrite plus nitrate (rho = 0.573). There also were few strong correlations among the solutes, except for a positive correlation between calcium and nitrate (rho = 0.764). The lack of strong correlations among these solutes probably is related to hydrologic factors. Streamflow is supplied primarily by ground-water discharge from a carbonate aquifer, which maintains a relatively constant flow rate and stream composition throughout most of the year. The correlations between nitrate and discharge and nitrate and calcium probably result from leaching of inorganic nitrogen from agricultural land and livestock yards during high-flow periods when discharge from shallow flow paths may be an important component of streamflow.
Table 31. Spearman rank correlation coefficients (rho values) showing the relation among discharge, pH, and major dissolved constituents, North Fork Whitewater River, Minnesota, 1967-93
[Q, discharge; Ca, calcium; Mg, magnesium; Na, sodium; K, potassium; Alk, alkalinity; SO4, sulfate; Cl, chloride; N, nitrite plus nitrate; Si, silica]
|
|
Q |
pH |
Ca |
Mg |
Na |
K |
Alk |
SO4 |
Cl |
N |
| pH |
-0.192 |
|
|
|
|
|
|
|
|
|
| Ca |
.345 |
0.106 |
|
|
|
|
|
|
|
|
| Mg |
-.374 |
.254 |
0.428 |
|
|
|
|
|
|
|
| Na |
-.126 |
.097 |
.127 |
0.363 |
|
|
|
|
|
|
| K |
.480 |
-.167 |
-.065 |
-.596 |
-0.097 |
|
|
|
|
|
| Alk |
-.228 |
.196 |
.471 |
.606 |
.183 |
-0.342 |
|
|
|
|
| SO4 |
.257 |
-.010 |
.556 |
.261 |
.118 |
.021 |
0.329 |
|
|
|
| Cl |
.471 |
-.007 |
.523 |
.106 |
.402 |
.191 |
.108 |
0.359 |
|
|
| N |
.573 |
-.053 |
.764 |
.092 |
.041 |
.096 |
.230 |
.532 |
0.602 |
|
| Si |
-.163 |
-.102 |
.337 |
.356 |
.197 |
-.067 |
.389 |
.167 |
.005 |
0.207 |
Results of the seasonal Kendall test for trends in discharge and major dissolved constituents are listed in table 32. Statistically significant trends were observed in discharge and most of the major dissolved constituents at the 0.01 probability level. Trends in calcium, magnesium, sodium, alkalinity, chloride, nitrite plus nitrate, and silica were similar for unadjusted and flow-adjusted concentrations, indicating that trends were not caused by the trend in stream discharge. The LOWESS curves in figure 17 show several different trend patterns at this station. The largest relative increases occurred in sodium, chloride, and nitrite-plus-nitrate concentrations, which at least doubled during the period of record. Most of the increase in sodium and chloride concentrations occurred before 1985; however, the magnitude of the trend in flow-adjusted chloride [10 (meq/L)/yr] was twice that of flow-adjusted sodium [5 (meq/L)/yr]. The upward trend in nitrite plus nitrate was more erratic than the trends in sodium and chloride, perhaps owing, in part, to analytical bias. By contrast, the increases in calcium, magnesium, potassium, alkalinity, sulfate, and silica concentrations were small (4 to 18 percent). Upward trends in sodium and chloride most likely are caused by changes in land-use activities in the basin, such as increased use of deicing salts, discharge from septic systems and the wastewater-treatment facility, and application of fertilizers to croplands. The difference in magnitude between the sodium and chloride trends was somewhat unexpected and may indicate part of the sodium from human-related sources is replacing calcium and magnesium on cation-exchange sites in the soil (Rittmaster and Shanley, 1995). The upward trend in nitrite-plus-nitrate concentrations probably also reflects changes in land-use activities because stream-water nitrogen is primarily derived from fertilizer and animal wastes. The source of trends in the remaining constituents is less clear. Landscape disturbance associated with croplands and residential areas has the potential to increase rates of base cation leaching and may result in higher stream-water alkalinity (Stoddard and Murdoch, 1991). Because sulfate and silica also are derived from geologic sources, landscape disturbance may affect stream-water concentrations of these solutes as well.
Table 32. Results of the seasonal Kendall test for trends in discharge and unadjusted and flow-adjusted pH and major dissolved constituents, North Fork Whitewater River, Minnesota, August 1967 through September 1993
[Trends in units of microequivalents per liter per year, except discharge in cubic meters per second per year, pH in standard units per year, and silica in micromoles per liter per year; inst., instantaneous; <, less than; --, not calculated]
|
Parameter |
Unadjusted |
Flow adjusted |
||
|
Trend |
p-value |
Trend |
p-value |
|
| Discharge, inst. |
0.02 |
0.000 |
-- |
-- |
| pH |
<.01 |
.120 |
0.01 |
0.021 |
| Calcium |
22.8 |
.000 |
26.3 |
.000 |
| Magnesium |
8.1 |
.000 |
15.4 |
.000 |
| Sodium |
6.1 |
.000 |
5.0 |
.000 |
| Potassium |
-.3 |
.080 |
-1.0 |
.000 |
| Alkalinity, laboratory |
8.4 |
.005 |
22.7 |
.000 |
| Sulfate |
1.4 |
.034 |
.2 |
.000 |
| Chloride |
14.8 |
.000 |
10.0 |
.000 |
| Nitrite plus nitrate |
7.8a |
.000 |
7.2a |
.000 |
| Silica |
1.0 |
.005 |
1.4 |
.002 |
a Trend calculated for 1971-93.
Synoptic Water-Quality Data
Results of the surface-water synoptic sampling in the North Fork Whitewater River Basin on August 20, 1992, are listed in table 33, and the locations of the sampling sites are shown in figure 16. During the sampling period, discharge at the gaging station was about 1.1 m³/s compared to the median discharge of 0.9 m³/s for November (Lawrence, 1987), indicating that the basin was sampled during normal flow conditions for that time of year. The concentrations of most solutes measured at site 1 during the synoptic sampling were between the first- and third-quartile concentrations reported for the HBN station during the entire period of record (table 30). The tributary streams were similar in composition to stream water collected at the gaging station (site 1); calcium and magnesium were the predominant cations, and bicarbonate was the predominant anion. Ion balances were slightly negative for all samples and ranged from -0.4 to -2.1 percent.
Table 33. Physical properties and major dissolved constituents from surface-water sampling sites in the North Fork Whitewater River Basin, Minnesota, collected August 20, 1992
[Site locations shown in fig. 16; Q, discharge in cubic meters per second; SC, specific conductance in microsiemens per centimeters at 25 degrees Celsius; pH in standard units; Ca, calcium; Mg, magnesium; Na, sodium; K, potassium; Alk, alkalinity; SO4, sulfate; Cl, chloride; NO3, nitrate; Si, silica; concentrations in microequivalents per liter, except silica in micromoles per liter; WTP, wastewater-treatment plant; criteria used in selection of sampling sites: MT = major tributary, LU = land use]
|
Site |
Station number |
Q |
SC |
pH |
Ca |
Mg |
Na |
K |
Alk |
SO4 |
Cl |
NO3 |
Si |
Criteria |
Remarks |
|
1 |
5376000 |
1.1 |
560 |
8.1 |
3,750 |
2,080 |
270 |
62 |
5,240 |
330 |
390 |
240 |
250 |
-- |
Gaging station |
|
2 |
440350092161400 |
.020 |
700 |
8.3 |
4,450 |
2,480 |
340 |
44 |
5,440 |
440 |
850 |
860 |
300 |
LU | Cropland |
|
3 |
440520092165900 |
.0085 |
600 |
8.6 |
4,200 |
2,000 |
280 |
79 |
4,980 |
500 |
730 |
430 |
220 |
LU | Cropland |
|
4 |
440535092163400 |
.031 |
670 |
8.6 |
4,350 |
2,320 |
300 |
72 |
5,340 |
460 |
850 |
700 |
270 |
LU | Cropland |
|
5 |
440554092074700 |
.14 |
640 |
8.3 |
4,150 |
2,480 |
250 |
49 |
5,580 |
400 |
510 |
480 |
270 |
MT | Forested along stream |
|
6 |
440603092072900 |
.48 |
600 |
8.2 |
3,550 |
2,160 |
440 |
79 |
5,000 |
400 |
700 |
320 |
200 |
MT | Forested along stream |
|
7 |
440721092193800 |
.017 |
680 |
8.6 |
4,650 |
2,400 |
280 |
51 |
5,800 |
440 |
820 |
520 |
300 |
MT, LU | Cropland |
|
8 |
440743092141700 |
.10 |
640 |
8.1 |
4,100 |
2,080 |
310 |
92 |
5,240 |
480 |
730 |
430 |
230 |
LU | Downstream from Elgin |
|
9 |
440806092081400 |
.048 |
1,380 |
8.2 |
3,850 |
2,880 |
6,090 |
236 |
5,720 |
1,080 |
5,630 |
680 |
320 |
LU | Downstream from WTP |
The concentrations of the weathering-derived constituents did not vary markedly among the sampled tributary sites (table 33). For example, alkalinity ranged from a minimum of 4,980 meq/L at site 3 to a maximum of 5,800 meq/L in Dry Creek upstream from Elgin (site 7). Calcium concentrations ranged from 3,550 to 4,650 meq/L, and magnesium ranged from 2,000 to 2,880 meq/L. The widespread presence and rapid weathering rates of carbonate minerals in the bedrock and surfical deposits are the most likely reasons for the lack of substantial spatial variation in the concentrations of these solutes. Differences in the concentration of the remaining solutes seem to be related largely to human activities in the basin. Several solutes were elevated downstream from the wastewater-treatment plant at Plainview (site 9) compared to other sampling sites in the basin. For example, sodium and chloride concentrations were 6,090 and 5,630 meq/L, respectively, at site 9 compared to the average sodium and chloride concentrations of 310 and 700 meq/L, respectively, at the other sampling sites in the basin. The wastewater- treatment plant also apparently had a slight effect on stream-water potassium and sulfate concentrations based on the elevated concentrations of these solutes at site 9. Despite the high concentrations at site 9, the wastewater-treatment plant did not seem to substantially affect the surface-water chemistry at the gaging station (site 1), probably because of the low discharge at site 9 compared to the discharge at the gage. Nitrate concentrations at the sampling sites ranged from 240 meq/L at site 1 to 860 meq/L at site 2. All sites had nitrate concentrations greater than the background concentration of 210 meq/L (3 mg/L) for ground water in southeastern Minnesota (Smith and Nemetz, 1996), and two of the tributaries (sites 2 and 4) had concentrations at or greater than the drinking-water standard of 710 meq/L (10 mg/L), indicating widespread nitrate contamination of stream water in the basin.
References Cited
Argabright, M.S., Cronshey, R.G., Helms, J.D., Pavelis, G.A., and Sinclair, H.R., Jr., 1996, Historical changes in soil erosion, 1930-1992, the northern Mississippi Valley Loess Hills: U.S. Department of Agriculture Natural Resources Conservation Service, Resource Economics and Social Sciences Division Historical Notes 5, 92 p.
Bailey, R.G., Avers, P.E., King, T., and McNab, W.H., eds., 1994, Ecoregions and subregions of the United States with supplementary table of map unit descriptions: Washington, D.C., U.S. Department of Agriculture Forest Service, scale 1:7,500,000(also at URL http://www.fs.fed.us/land/ecosysmgmt/ecoreg1_home.html, accessed 1998).
Durum, W.H., 1978, Historical profile of quality of water laboratories and activities, 1879-1973: U.S. Geological Survey Open-File Report 78-432, 235 p.
Hobbs, H.C., 1984, Surficial geology, in Geologic atlas of Winona County, Minnesota: Minnesota Geological Survey County Atlas Series, Atlas C-2, plate 3, scale 1:100,000.
Hobbs, H.C., 1988, Surficial geology, in Geologic atlas of Olmsted County, Minnesota: Minnesota Geological Survey County Atlas Series, Atlas C-3, plate 3, scale 1:100,000.
Lawrence, C.L., 1987, Streamflow characteristics at hydrologic benchmark stations: U.S. Geological Survey Circular 941, 123 p.
Lueth, R.A., 1994, Soil survey of Winona County, Minnesota: U.S. Department of Agriculture Soil Conservation Service, 278 p., 100 folded plates.
McCleary, F.E., Feusner, M.M., and Hamilton, S.J., 1989, Soil survey of Scioto County, Ohio: U.S. Department of Agriculture Soil Conservation Service, 207 p., 78 folded plates.
Mitton, G.B., Wakeman, E.S., and Guttormson, K.G., 1996, Water resources data, Minnesota, water year 1995: U.S. Geological Survey Water-Data Report MN-95-1, 389 p.
Mossler, J.H., and Book, P.R., 1984, Bedrock geology, in Geologic atlas of Winona County, Minnesota: Minnesota Geological Survey County Atlas Series, Atlas C-2, scale 1:100,000.
Rittmaster, R.L., and Shanley, J.B., 1995, Factors affecting water quality and net flux of solutes in two stream basins in the Quabbin Reservoir drainage basin, central Massachusetts, 1983-85: U.S. Geological Survey Water-Resources Investigations Report 94-4003, 66 p.
Schertz, T.L., Wells, F.C., and Ohe, D.J., 1994, Sources of trends in water-quality data for selected streams in Texas, 1975-89 water years: U.S. Geological Survey Water-Resources Investigations Report 94-4213, 49 p.
Smith, E.S., and Nemetz, D.A., 1996, Water quality along selected flowpaths in the Prairie du Chien-Jordon aquifer, southeastern Minnesota: U.S. Geological Survey Water-Resources Investigations Report 95-4115, 76 p.
Stoddard, J.L., and Murdoch, P.A., 1991, Catskill Mountains, in Charles, D.F., Acidic deposition and aquatic ecosystems-Regional case studies: New York, Springer-Verlag, p. 237-272.
U.S. Department of Agriculture, 1996, Watershed Plan and Environmental Assessment-Whitewater River Watershed, Olmsted, Wabasha, and Winona Counties, Minnesota: St. Paul, Minn., Natural Resources Conservation Service (also at URL http://www.mn.nrcs.usda.gov/watersheds/watershed.html).
Appendix A. List of Map References
a. U.S. Geological Survey topographic maps:
- Beaver, Minnesota (1:24,000), 1977
- Chester, Minnesota (1:24,000), 1972
- Elba, Minnesota (1:24,000), 1977, gaging station on this quadrangle
- Millville, Minnesota (1:24,000), 1972
- Plainview, Minnesota (1:24,000), 1972
- Plainview SW, Minnesota (1:24,000), 1972
- Rochester, Minnesota (1:100,000), 1989
b. Geologic maps:
- Balaban, N.H., ed., 1988, Geologic atlas of Olmstead County, Minnesota: St. Paul, Minnesota Geological Survey, 9 plates containing 1. base map, 2. bedrock geology, 3. surficial geology, 4. depth to bedrock and bedrock topography, 5. sensitivity of the ground-water system to pollution, 6. sinkholes and sinkhole probability, 7. geology and well construction, 8. geology and well construction, and 9. geologic resources, scale 1:100,000.
c. Soil surveys:
- Lueth, R.A., 1994, Soil survey of Winona County, Minnesota: U.S. Department of Agriculture Soil Conservation Service, 278 p.
Appendix B. NWIS Site-Identification Numbers
Table B-1. NWIS site-identification numbers and site names for water-quality sampling sites.
|
Site |
Identification Number |
Site Name |
|
1 |
05376000 |
N FORK WHITEWATER R NR ELBA MINNESOTA |
|
2 |
440350092161400 |
N FORK WHITEWATER R NR VIOLA MINNESOTA |
|
3 |
440520092165900 |
PIPELINE TRIB NR VIOLA MINNESOTA |
|
4 |
440535092163400 |
N FORK WHITEWATER R NR RR BEND NR VIOLA MINNESOTA |
|
5 |
440554092074700 |
LOGAN BRANCH NR ELBA MINNESOTA |
|
6 |
440603092072900 |
N FORK WHITEWATER R AB LOGAN BR NR ELBA MINNESOTA |
|
7 |
440721092193800 |
DRY CREEK ABOVE EGLIN MINNESOTA |
|
8 |
440743092141700 |
N FORK WHITEWATER R BLW ELGIN MINNESOTA |
|
9 |
440806092081400 |
PLAINVIEW TRIB NR ELBA MINNESOTA |
| Back to 1173-B Contents |
This page maintained by Nichole Bisceglia.
Last updated July 17, 2000.