
Hydrologic Benchmark Network Stations in the West-Central U.S. 1963-95 (USGS Circular 1173-C)
|
|
|
|
|
Halfmoon Creek near Malta, Colorado (07083000)
Hydrologic Benchmark Network Stations in the West-Central U.S. 1963-95 (USGS Circular 1173-C)
|
|
|
|
|
Halfmoon Creek near Malta, Colorado (07083000)
To download a printer friendly PDF version of this information click here.
This report details one of the approximately 50 stations in the Hydrologic Benchmark Network (HBN) described in the four-volume U.S. Geological Survey Circular 1173. The suggested citation for the information on this page is:
|
Clark, M.L., Eddy-Miller, C.A., Mast, M.A., 2000, Environmental characteristics and water-quality of Hydrologic Benchmark Network stations in the West-Central United States, U.S. Geological Survey Circular 1173-C, 115 p. |
All of the tables and figures are numbered as they appear in each circular. Use the navigation bar above to view the abstract, introduction and methods for the entire circular, as well as a map and list of all of the HBN sites. Use the table of contents below to view the information on this particular station.
|
Table of Contents |
| 1. Site Characteristics and Land Use |
| 2. Historical Water Quality Data and Time-Series Trends |
| 3. Synoptic Water Quality Data |
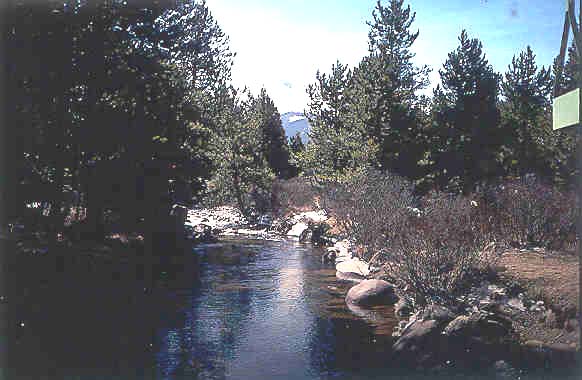
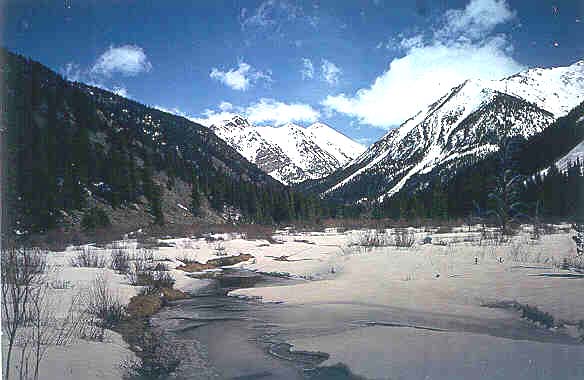
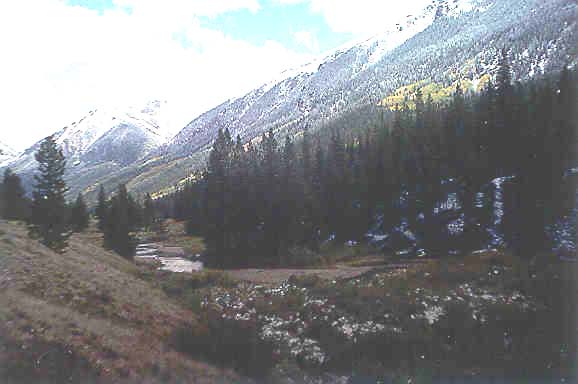
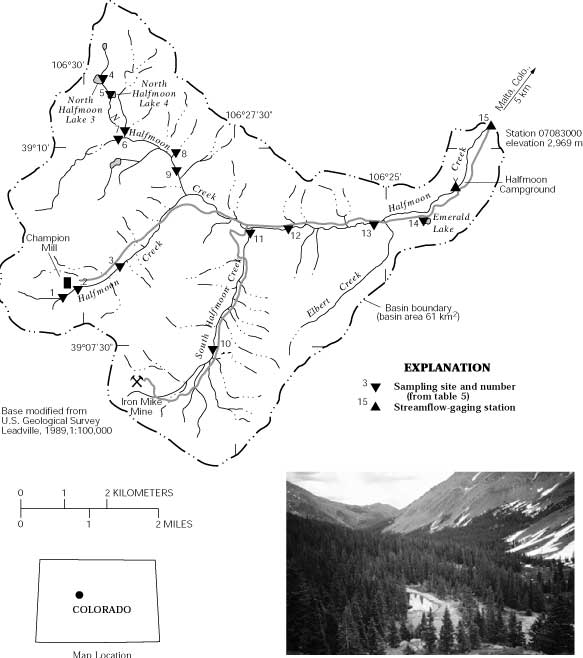
The Halfmoon Creek HBN Basin is in the Southern Rocky Mountains physiographic province (Fenneman, 1946) in central Colorado (Figure 2. Map showing study area in Halfmoon Creek Basin and photograph of the landscape of the basin). Halfmoon Creek drains 61 km² of rugged, mountainous terrain of the Sawatch Range. Elevations in the basin range from 2,969 to 4,399 m. The basin drains parts of Mount Elbert and Mount Massive, which are the second and third highest peaks, respectively, in the conterminous United States. The HBN station is about 6.9 km southwest of Malta, Colo., at a latitude of 39×10'20'' and a longitude of 106×23'19''. The ecoregion of the basin is classified as the Southern Rocky Mountain Steppe-Open Woodland-Coniferous Forest-Alpine Meadow Province (Bailey, 1995). The basin contains forested montane and subalpine zones. The northern slopes of the basin are heavily forested, whereas the south-facing slopes have sparse vegetation (W.A. Swensen, U.S. Geological Survey, written commun., 1997). Timber species in the lower part of the basin include lodgepole pine, Engelmann spruce, and fir. The upper basin (above 3,600 m) is alpine tundra.
 |
The geology of the upper basin is dominated by metamorphic rocks of Precambrian age, including biotite gneiss, schist, and migmatite (Van Loenen, 1985). The biotite gneiss is the most abundant rock type. Schist is next most abundant and contains varying amounts of sillimanite, garnet, hornblende, and muscovite. The remaining rock types, in order of decreasing abundance, are migmatite; quartz-rich, feldspathic gneiss; and calc-silicate gneiss. Small amounts of pegmatite also are present. Small intrusive masses of rhyolitic composition and small dikes of similar composition cut across the gneiss. Mineral deposits occur in brecciated zones of the intrusive rock. Some small vein deposits have high mineral-resource potential for gold, silver, lead, and zinc (Van Loenen and others, 1989). Talus from landslides and avalanche debris accumulate below steep ridges, whereas glacial material is deposited in the lower basin. Glacial deposits contain boulder till and gravel in moraines and outwash. The soil on glacial deposits on the mountains (slopes from 3 to 35 percent) generally is gravelly, sandy loam (U.S. Department of Agriculture, 1975a).
 |
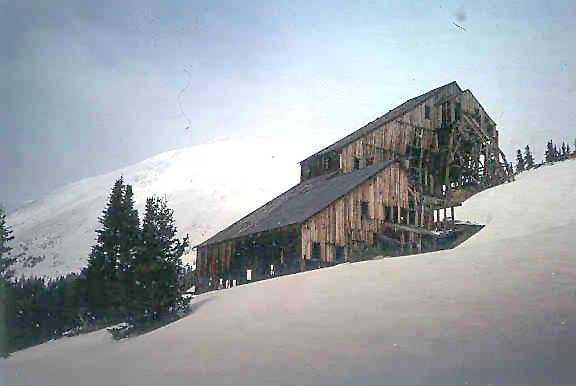
The Halfmoon Creek Basin lies entirely within Lake County and the San Isabel National Forest. The northern part of the basin lies within the Mount Massive Wilderness Area. Access to the lower part of the basin is by way of an improved, light-duty road. Access farther up the main stem of the drainage and some of the main tributaries is by four-wheel-drive roads and trails. Access may be restricted across private property, and mechanized vehicles are not allowed within the Mount Massive Wilderness Area. Access to the HBN station during the winter, as well as to the rest of the basin, is limited to snowmobiles, skis, or snowshoes. Recreational use in the basin is high, particularly in the summer. Activities include hiking, fishing, and camping. A U.S. Forest Service campground is upstream from the station, and the Mount Massive and Mount Elbert trailheads are both accessible from the basin. Several small, abandoned mines and an inactive mill are in the basin. Historically, small vein deposits of silver, gold, lead, and zinc yielded economic quantities of these metals from Halfmoon Creek Basin. Mining activity in Halfmoon Creek Basin, however, was less than in other drainages in the upper Arkansas River Basin. Other potential influences on water quality in the basin include grazing (U.S. Geological Survey, 1993, p. 200), a few residences, and past forest fires (Cobb and Biesecker, 1971).
The data set analyzed for the Halfmoon Creek HBN station includes 256 water-quality samples that were collected from July 1965 to August 1995. Sampling frequency is described on the basis of water year, which begins on October 1 and ends on September 30. Sampling frequency increased from 2 samples in 1965 to 12 samples in 1967 and remained at 10-12 samples per year from 1967 to 1980. Sampling frequency was variable during the period 1981-90 when between three to nine samples were collected annually. During the early 1990's, sampling frequency generally was bimonthly. Samples were analyzed at USGS district water-quality laboratories until the early 1970's. After 1973, with the creation of the USGS Central Laboratory System, all samples were analyzed at the water-quality laboratory (now called NWQL) in Arvada, Colo. The period of record for discharge is from water year 1946 to current year (2000). Daily water temperature was recorded from May 1967 to September 1982.
 |
The median and range of major-ion concentrations in stream water collected at the Halfmoon Creek HBN station and VWM concentrations in wet precipitation measured at the Manitou NADP station are presented in table 2. The NADP station is about 130 km east and south of the HBN station. Precipitation chemistry at the NADP station was dilute and acidic with a VWM pH of 4.9 during the period of record, 1978-95. The dominant cations in precipitation were hydrogen, which contributed 28 percent of the total cation concentration, and calcium and ammonium, which each contributed 26 percent. Sulfate and nitrate were the dominant anions in precipitation, contributing 48 and 46 percent, respectively, of the total anion concentration. A high proportion of nitrate in precipitation in the Rocky Mountains has been attributed to exhaust from cars and other vehicles in urban areas and agricultural activity in the Great Plains States (National Atmospheric Deposition Program/National Trends Network, 1997). Precipitation chemistry at a USGS study site in Halfmoon Creek Basin near the gaging station was slightly more dilute and less acidic with a VWM pH of about 5.1 during the period 1989-94 (A.J. Ranalli, U.S. Geological Survey, written commun., 1997).
[Parameters in units of microequivalents per liter, except for discharge in cubic meters per second, specific conductance in microsiemens per centimeter at 25 degrees Celsius, pH in standard units, and silica in micromoles per liter; n, number of stream samples; VWM, volume-weighted mean; spec. cond., specific conductance; --, not reported; <, less than]
|
Parameter |
Stream Water |
Precipitation VWM |
|||||
|
Minimum |
First quartile |
Median |
Third quartile |
Maximum |
n |
||
| Discharge |
0.04 |
0.13 |
0.28 |
0.88 |
6.8 |
247 |
-- |
| Spec. cond., field |
43 |
65 |
86 |
95 |
107 |
226 |
-- |
| pH, field |
5.7 |
7.2 |
7.5 |
7.8 |
8.9 |
245 |
4.9a |
| Calcium |
220 |
400 |
500 |
550 |
750 |
254 |
12 |
| Magnesium |
96 |
230 |
300 |
340 |
540 |
256 |
3.2 |
| Sodium |
26 |
48 |
65 |
78 |
130 |
253 |
4.4 |
| Potassium |
3.0 |
13 |
15 |
18 |
36 |
251 |
1.3 |
| Ammonium |
<.7 |
.7 |
1.4 |
4.3 |
16 |
100 |
12 |
| Alkalinity, laboratory |
320 |
580 |
760 |
840 |
980 |
251 |
-- |
| Sulfate |
6.2 |
90 |
110 |
130 |
270 |
253 |
22 |
| Chloride |
<2.8 |
8.5 |
14 |
25 |
70 |
254 |
2.9 |
| Nitrite plus nitrate |
2.1 |
7.1 |
9.3 |
12 |
24 |
183 |
21b |
| Silica |
20 |
70 |
95 |
110 |
160 |
254 |
-- |
a Laboratory pH.
b Nitrate only.
Stream water in Halfmoon Creek is a calcium bicarbonate type. The sum of ion concentrations ranged from about 830 to about 2,500 meq/L. Alkalinity ranged from 320 to 980 meq/L, and bicarbonate is the primary contributor to alkalinity at this station. Calcium (57 percent) and magnesium (34 percent) accounted for the largest part of the median cation concentration. Bicarbonate accounted for 85 percent of the median anion concentration. The dominance of calcium, magnesium, and bicarbonate reflect the weathering of calc-silicate gneiss, which was formed, in part, by the metamorphism of limestone or dolomite. Streams in basins with high annual runoff and geologic settings that contain
 |
Correlations among dissolved constituents and discharge were determined for Halfmoon Creek (table 3). Base cations and anions were inversely correlated with discharge. These results are consistent with a hydrologic system where base-flow chemistry that is dominated by ground water is diluted during periods of increased discharge, particularly during annual snowmelt runoff. Ion concentrations in ground water tend to be greater than in surficial sources because the contact time with rocks and minerals is longer. Among the solutes, strong, positive correlations existed among base cations, particularly calcium and magnesium (rho value = 0.938), calcium and sodium (rho value = 0.880), and sodium and magnesium (rho value = 0.924). The relations of calcium, magnesium, and sodium with silica were strong and positively correlated (0.907, 0.949, and 0.941, respectively). Positive correlations among the base cations and alkalinity also were apparent (calcium, rho value = 0.878; magnesium, rho value = 0.898; and sodium, rho value = 0.847). Likewise, a strong correlation between alkalinity and silica was determined (rho value = 0.859). These relations reflect the weathering of feldspathic and calc-silicate minerals in the metamorphic rocks.
[Q, discharge; Ca, calcium; Mg, magnesium; Na, sodium; K, potassium; Alk, alkalinity; SO4, sulfate; Cl, chloride; SiO2, silica; --, not applicable]
|
|
Q |
pH |
Ca |
Mg |
Na |
K |
Alk |
SO4 |
Cl |
| pH |
0.006 |
-- |
-- |
-- |
-- |
-- |
-- |
-- |
-- |
| Ca |
-.881 |
0.082 |
-- |
-- |
-- |
-- |
-- |
-- |
-- |
| Mg |
-.930 |
.044 |
0.938 |
-- |
-- |
-- |
-- |
-- |
-- |
| Na |
-.927 |
-.059 |
.880 |
0.924 |
-- |
-- |
-- |
-- |
-- |
| K |
-.523 |
.015 |
.536 |
.591 |
0.593 |
-- |
-- |
-- |
-- |
| Alk |
-.893 |
.092 |
.878 |
.898 |
.847 |
0.487 |
-- |
-- |
-- |
| SO4 |
-.556 |
-.094 |
.590 |
.625 |
.620 |
.448 |
0.461 |
-- |
-- |
| Cl |
-.236 |
-.071 |
.170 |
.263 |
.247 |
.433 |
.230 |
0.217 |
-- |
| SiO2 |
-.940 |
-.043 |
.907 |
.949 |
.941 |
.584 |
.859 |
.628 |
0.219 |
Results of the seasonal Kendall test for trends in discharge and major dissolved constituents for Halfmoon Creek from 1965 through 1995 are presented in table 4. A statistically significant (a = 0.01) downward trend for dissolved chloride and a significant upward trend in pH were detected in both unadjusted and flow-adjusted concentrations. A statistically significant upward trend for dissolved silica was detected in the flow-adjusted concentrations. The results of the flow-adjusted tests indicate the changes in hydrogen, chloride, and silica concentrations probably were not driven by changes in stream discharge. The upward trend in pH contrasts with the significant downward trend (a = 0.01) in stream-water pH at this station that was observed for the period from the mid-1960's to 1981 (Smith and Alexander, 1983). Likewise, a significant downward trend (a = 0.01) in alkalinity determined during the same period is no longer detected. Lewis and Grant (1980) reported decreasing pH and increasing nitrate concentrations in precipitation along the nearby Rocky Mountain Front Range for the period 1975-78. Kling and Grant (1984) correlated decreasing pH and alkalinity with increasing elevation in lakes in the nearby Front Range. The trend of increasing pH, however, is consistent with a more recent study (Lynch and others, 1995), which found increasing pH in precipitation at the Manitou NADP station for the period 1980-92. The downward trend in chloride concentrations is consistent with decreasing chloride concentrations in precipitation at the Manitou station. Some negative bias, however, may have been introduced in the stream-water chloride concentrations from the change in analytical methods for chloride from colorimetric during the 1970's to a ferric thio-cyanate to automated segmented flow method during the 1980's, to ion exchange chromatography around 1990 (H.D. Ardourel, U.S. Geological Survey, written commun., 1997). The reason for the upward trend in flow-adjusted silica concentrations could not be determined.
[Trends in units of microequivalents per liter per year, except for discharge in cubic meters per second per year, pH in standard units per year, and silica in micromoles per liter per year; p-value, attained significance level; --, not calculated; <, less than]
|
Parameter |
Unadjusted |
Flow adjusted |
||
|
Trend |
p-value |
Trend |
p-value |
|
| Discharge |
0.00 |
0.956 |
-- |
-- |
| pH |
.03 |
<.001 |
0.03 |
<0.001 |
| Calcium |
<.01 |
.092 |
.7 |
.013 |
| Magnesium |
<.01 |
.599 |
.4 |
.201 |
| Sodium |
<.01 |
.574 |
.05 |
.609 |
| Potassium |
<.01 |
.650 |
.02 |
.489 |
| Alkalinity |
.8 |
.126 |
.8 |
.212 |
| Sulfate |
<.01 |
.962 |
.09 |
.733 |
| Chloride |
-.6 |
<.001 |
-.6 |
<.001 |
| Nitrite plus nitrate |
.03 |
.318 |
.05 |
.153 |
| Silica |
.3 |
.013 |
.3 |
.004 |
Results of surface-water synoptic sampling conducted during 1988, 1989, and 1990 in the Halfmoon Creek Basin are presented in table 5, and locations of the sampling sites are shown in figure 2. Discharge at the HBN station (site 15) during the four sampling events was 0.63 m³/s (July 1988), 0.17 m³/s (November 1988), 0.19 m³/s (March 1989), and 0.10 m³/s (March 1990) compared to the mean monthly discharge of 2.4, 0.21, and 0.10 m³/s for the months of July, November, and March, respectively (Crowfoot and others, 1996a).
[Site locations shown in fig. 2; Q, discharge in cubic meters per second; SC, specific conductance in microsiemens per centimeter at 25 degrees Celsius; pH in standard units; Ca, calcium; Mg, magnesium; Na, sodium; K, potassium; Alk, alkalinity; SO4, sulfate; Cl, chloride; NO3, nitrate; SiO2, silica; concentrations in microequivalents per liter, except silica is in micromoles per liter; --, not measured; <, less than; criteria used in selection of sampling sites:BG = bedrock geology, TRIB = major tributary, LU = land use]
|
Site |
Identification number |
Sample date |
Q |
SC |
pH |
Ca |
Mg |
Na |
K |
Alk |
SO4 |
Cl |
NO3 |
SiO2 |
Criteria |
|
1 |
390806106302200 |
07/26/88 |
0.034 |
76 |
7.2 |
430 |
240 |
42 |
7.4 |
520 |
190 |
1.4 |
4.4 |
57 |
LU |
|
|
10/31/88 |
-- |
98 |
-- |
600 |
270 |
48 |
8.5 |
490 |
380 |
3.7 |
16 |
58 |
||
|
2 |
390816106295700 |
10/31/88 |
-- |
104 |
7.8 |
560 |
360 |
50 |
10 |
670 |
270 |
3.9 |
13 |
62 |
LU |
|
03/22/89 |
<.001 |
127 |
8.0 |
750 |
380 |
74 |
12 |
710 |
440 |
8.5 |
14 |
72 |
|||
|
3 |
390830106292400 |
07/26/88 |
.10 |
75 |
7.5 |
430 |
250 |
40 |
9 |
570 |
130 |
2 |
4.5 |
55 |
LU |
|
10/31/88 |
-- |
94 |
7.9 |
550 |
310 |
52 |
10 |
640 |
220 |
5.1 |
13 |
62 |
|||
|
03/22/89 |
.005 |
113 |
8.0 |
650 |
340 |
74 |
12 |
760 |
140 |
5.6 |
15 |
68 |
|||
|
03/20/90 |
.004 |
116 |
7.6 |
700 |
380 |
78 |
14 |
830 |
290 |
2.8 |
21 |
73 |
|||
|
4 |
391050106294300 |
07/25/88 |
.003 |
28 |
-- |
160 |
72 |
23 |
3.8 |
220 |
29 |
2.5 |
-- |
32 |
BG |
|
5 |
391039106293400 |
07/25/88 |
.001 |
27 |
-- |
160 |
70 |
22 |
3.3 |
220 |
27 |
1.7 |
-- |
28 |
BG |
|
6 |
391010106292200 |
07/25/88 |
.099 |
38 |
-- |
220 |
120 |
26 |
5.4 |
310 |
46 |
2 |
3.9 |
42 |
TRIB |
|
7 |
391011106291900 |
07/25/88 |
.085 |
35 |
-- |
220 |
80 |
29 |
6.7 |
280 |
38 |
2.8 |
6.9 |
42 |
TRIB |
|
8 |
390955106283200 |
07/25/88 |
.003 |
53 |
-- |
300 |
160 |
65 |
11 |
420 |
63 |
4.8 |
18 |
82 |
TRIB |
|
9 |
390945106282800 |
07/25/88 |
.24 |
40 |
-- |
240 |
110 |
29 |
6.4 |
330 |
44 |
2.3 |
4.6 |
45 |
BG |
|
|
11/01/88 |
-- |
58 |
7.7 |
360 |
180 |
43 |
9 |
440 |
73 |
5.9 |
16 |
62 |
|
|
|
|
03/23/89 |
.012 |
59 |
7.7 |
320 |
180 |
48 |
8.7 |
440 |
77 |
4.8 |
15 |
65 |
|
|
|
|
03/21/90 |
.033 |
58 |
7.7 |
340 |
180 |
48 |
9.5 |
460 |
73 |
<.3 |
18 |
68 |
|
|
|
10 |
390724106275100 |
07/26/88 |
.097 |
79 |
7.6 |
490 |
220 |
52 |
14 |
660 |
98 |
3.9 |
5.9 |
67 |
LU |
|
11 |
390901106271200 |
07/26/88 |
.17 |
93 |
7.9 |
550 |
300 |
57 |
15 |
790 |
100 |
3.4 |
8.6 |
75 |
TRIB |
|
|
|
11/01/88 |
-- |
108 |
8.0 |
650 |
370 |
61 |
18 |
910 |
130 |
6.2 |
14 |
78 |
|
|
|
|
03/22/89 |
.01 |
113 |
8.2 |
700 |
390 |
70 |
18 |
960 |
150 |
5.6 |
16 |
82 |
|
|
|
|
03/21/90 |
.025 |
116 |
8.1 |
700 |
380 |
70 |
18 |
990 |
140 |
<.3 |
21 |
85 |
|
|
12 |
390901106263600 |
07/26/88 |
.50 |
70 |
7.8 |
400 |
220 |
41 |
10 |
580 |
77 |
2.8 |
6.8 |
62 |
BG |
|
|
|
11/01/88 |
-- |
91 |
7.9 |
500 |
310 |
57 |
15 |
740 |
110 |
6.2 |
14 |
73 |
|
|
|
|
03/22/89 |
.054 |
96 |
8.1 |
550 |
330 |
61 |
15 |
780 |
120 |
5.6 |
16 |
77 |
|
|
|
|
03/21/90 |
.052 |
97 |
7.9 |
550 |
330 |
61 |
16 |
820 |
130 |
5.1 |
18 |
82 |
|
|
13 |
390905106250700 |
07/26/88 |
.58 |
72 |
7.8 |
410 |
240 |
43 |
11 |
600 |
81 |
3.1 |
7.1 |
65 |
BG |
|
|
|
11/01/88 |
-- |
96 |
7.8 |
550 |
350 |
61 |
16 |
790 |
120 |
5.9 |
10 |
85 |
|
|
|
|
03/23/89 |
.067 |
99 |
8.1 |
550 |
350 |
74 |
16 |
850 |
130 |
6.5 |
11 |
110 |
|
|
|
|
03/21/90 |
.063 |
102 |
7.7 |
550 |
350 |
74 |
17 |
880 |
120 |
2.8 |
14 |
93 |
|
|
14 |
390906106242000 |
06/26/88 |
-- |
35 |
-- |
180 |
110 |
48 |
10 |
300 |
30 |
4.2 |
1.5 |
72 |
BG |
|
15 |
07083000 |
07/26/88 |
.63 |
79 |
8.0 |
420 |
260 |
52 |
12 |
620 |
82 |
4.2 |
6.2 |
24 |
|
|
|
|
11/01/88 |
.17 |
95 |
7.9 |
500 |
340 |
65 |
16 |
810 |
120 |
7.6 |
8.2 |
30 |
|
|
|
|
03/22/89 |
.19 |
99 |
8.1 |
550 |
350 |
78 |
17 |
800 |
120 |
7.1 |
9.2 |
35 |
|
|
|
|
03/21/90 |
.10 |
100 |
7.8 |
550 |
350 |
78 |
18 |
840 |
130 |
.3 |
9.6 |
37 |
|
The water type of samples from all sites in the basin was calcium bicarbonate. The sum of ions in tributary streams ranged from about 660 (site 7, July 1988) to about 2,400 meq/L (site 2, March 1989). The sum of ions at the HBN station (site 15) ranged from about 1,500 (July 1988) to about 2,000 meq/L (March 1990). Concentrations of most dissolved constituents measured during synoptic sampling of the tributaries were within the range of dissolved-constituent concentrations measured at the HBN station for the record period 1965-95 (table 2). Concentrations of dissolved sulfate at sites 1, 2, and 3 exceeded the historical maximums for the HBN station. Ion concentrations were generally more dilute in the three lake sites: North Halfmoon Lake No. 3 (site 4), North Halfmoon Lake No. 4 (site 5), and Emerald Lake (site 14); ion concentrations in the lakes ranged from 500 (site 5) to 680 meq/L (site 14). Several constituents measured in the lake samples were less than the minimum concentration detected at the HBN station during 1965-95.
Concentrations of most major ions (including calcium, magnesium, sodium, bicarbonate, and sulfate) were lower in stream water of North Halfmoon Creek and its tributaries (sites 6-9) compared to Halfmoon Creek and South Halfmoon Creek. The elevated sulfate concentrations in samples that were collected from the upper Halfmoon Creek drainage (sites 1, 2, and 3) coincide with the mineralized zone identified as having high mineral-resource potential. Placer mining for low-grade gold has occurred along upper Halfmoon Creek (Van Loenen and others, 1989). Increased sulfate concentrations are associated with the oxidation of iron-sulfide minerals, particularly pyrite, which commonly are associated with precious metal deposits (Deer and others, 1966, p. 448). Mining operations expose sulfide minerals to air and water, increasing the potential for oxidation (Hem, 1992, p. 111). The sulfate concentration at site 10 (98 meq/L), below a historical mine site on South Halfmoon Creek, however, was less than the median sulfate at the HBN station. The South Halfmoon Creek drainage is outside the high mineral-resource potential zone. In all drainages, the stream waters were near neutral to moderately alkaline (pH = 7.2 to 8.2) during the synoptic study.
Bailey, Robert G., 1995, Descriptions of the ecoregions of the United States: U.S. Department of Agriculture, Forest Service, Miscellaneous Publication 1391, 108 p.
Biesecker, J.E., and Leifeste, D.K., 1975, Water quality of hydrologic benchmarks-An indicator of water quality in the natural environment: U.S. Geological Survey Circular 460-E, 21 p.
Cobb, E.D., and Biesecker, J.E., 1971, The National Hydrologic Bench-Mark Network: U.S. Geological Survey Circular 460-D, 38 p.
Crowfoot, R.M., Ugland, R.C., Maura, W.S., Steger, R.D., and O'Neill, G.B., 1996a, Water resources data, Colorado, water year 1995-v. 1, Missouri River Basin, Arkansas River Basin, and Rio Grande Basin: U.S. Geological Survey Water-Data Report CO-95-1, 506 p.
Deer, W.A., Howie, R.A., and Zussman, J., 1966, An introduction to the rock-forming minerals: England, Longman Group Limited, 528 p.
Fenneman, N.M., 1946, Physical divisions of the United States: Washington, D.C., U.S. Geological Survey special map, scale 1:7,000,000.
Hem, J.D., 1992, Study and interpretation of the chemical characteristics of natural water: U.S. Geological Survey Water-Supply Paper 2254, 263 p.
Lynch, J.A., Bowersox, V.C., and Grimm, J.W., 1995, Trends in precipitation chemistry in the United States-A national perspective, 1980-92: Atmospheric Environment, v. 29, no. 11. p. 1231-1246.
National Climatic Data Center, 1996, Summary of the day, CD-ROM: Boulder, Colorado, EarthInfo Incorporated.
Smith, R.A., and Alexander, R.B., 1983, Evidence for acid-precipitation-induced trends in stream chemistry at hydrologic benchmark stations: U.S. Geological Survey Circular 910, 12 p.
U.S. Department of Agriculture, 1975a, Soil survey of Chaffee-Lake area, Colorado: U.S. Department of Agriculture, Soil Conservation Service, 78 p.
U.S. Geological Survey, 1993, National water summary 1990-91-Hydrologic events and stream water quality: U.S. Geological Survey Water-Supply Paper 2400, 590 p.
U.S. Geological Survey, 1982, Program and plan-National water-quality networks FY1983: Office of Water Quality Technical Memorandum No. 82.18, accessed December 27, 1999, at URL http://water.usgs.gov/ admin/memo/
U.S. Geological Survey, 1983, Analytical methods-Sulfate determinations: Office of Water Quality Technical Memorandum No. 83.07, accessed December 27, 1999, at URL http://water.usgs.gov/admin/memo/
U.S. Geological Survey, 1989, Analytical methods-Turbidimetric sulfate method: Office of Water Quality Technical Memorandum No. 90.04, accessed December 27, 1999, at URL http://water.usgs.gov/admin/memo/
U.S. Geological Survey, 1990, Programs and plans-National water-quality networks FY1991: Office of Water Quality Technical Memorandum No. 90.13, accessed December 27, 1999, at URL http://water.usgs.gov/admin/memo/.
Van Loenen, R.E., 1985, Geologic map of the Mount Massive Wilderness, Lake County, Colorado: U.S. Geological Survey Miscellaneous Field Studies Map 1792-A, 1 pl.
Van Loenen, R.E., Lee, G.K., Campbell, D.L., and Thompson, J.R, 1989, Mineral resource potential of Mount Massive Wilderness, Lake County, Colorado: U.S. Geological Survey Bulletin 1636, 18 p., scale 1:50,000.
a. U.S. Geological Survey topographic maps:
b. Geologic maps:
c. Soil surveys:
d. Other maps:
Table B-1. NWIS site-identification numbers and site names for water-quality sampling sites.
|
Site |
Identification Number |
Site Name |
|
1 |
390806106302200 |
Halfmoon Creek above Champion Mill |
|
2 |
390816106295700 |
Halfmoon Creek below Champion Mill |
|
3 |
390830106292400 |
Halfmoon Creek near Prospect Mine |
|
4 |
391050106294300 |
North Halfmoon Lake number 3 |
|
5 |
391039106293400 |
North Halfmoon Lake number 4 |
|
6 |
391010106292200 |
North Halfmoon Creek above north branch of creek |
|
7 |
391011106291900 |
north branch of North Halfmoon Creek below Halfmoon Lakes |
|
8 |
390955106283200 |
third unnamed tributary to north Halfmoon Creek at mouth |
|
9 |
390945106282800 |
North Halfmoon Creek 0.42 mile above Halfmoon Creek |
|
10 |
390724106275100 |
South Halfmoon Creek near Iron Mike Mine |
|
11 |
390901106271200 |
South Halfmoon Creek above Halfmoon Creek |
|
12 |
390901106263600 |
Halfmoon Creek above Bog |
|
13 |
390905106250700 |
Halfmoon Creek above Elbert Creek |
|
14 |
390906106242000 |
Emerald Lake |
|
15 |
07083000 |
Halfmoon Creek near Malta, Colorado |
| Back to 1173-C Contents |
This page maintained by Richard Hooper.
Last updated July 31, 2000.