
Hydrologic Benchmark Network Stations in the West-Central U.S. 1963-95 (USGS Circular 1173-C)
|
|
|
|
|
Dismal River near Thedford, Nebraska (06775900)
Hydrologic Benchmark Network Stations in the West-Central U.S. 1963-95 (USGS Circular 1173-C)
|
|
|
|
|
Dismal River near Thedford, Nebraska (06775900)
To download a printer friendly PDF version of this information click here.
This report details one of the approximately 50 stations in the Hydrologic Benchmark Network (HBN) described in the four-volume U.S. Geological Survey Circular 1173. The suggested citation for the information on this page is:
|
Clark, M.L., Eddy-Miller, C.A., Mast, M.A., 2000, Environmental characteristics and water-quality of Hydrologic Benchmark Network stations in the West-Central United States, U.S. Geological Survey Circular 1173-C, 115 p. |
All of the tables and figures are numbered as they appear in each circular. Use the navigation bar above to view the abstract, introduction and methods for the entire circular, as well as a map and list of all of the HBN sites. Use the table of contents below to view the information on this particular station.
|
Table of Contents |
| 1. Site Characteristics and Land Use |
| 2. Historical Water Quality Data and Time-Series Trends |
| 3. Synoptic Water Quality Data |
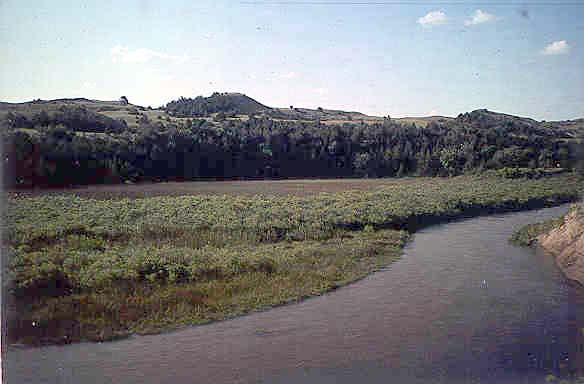
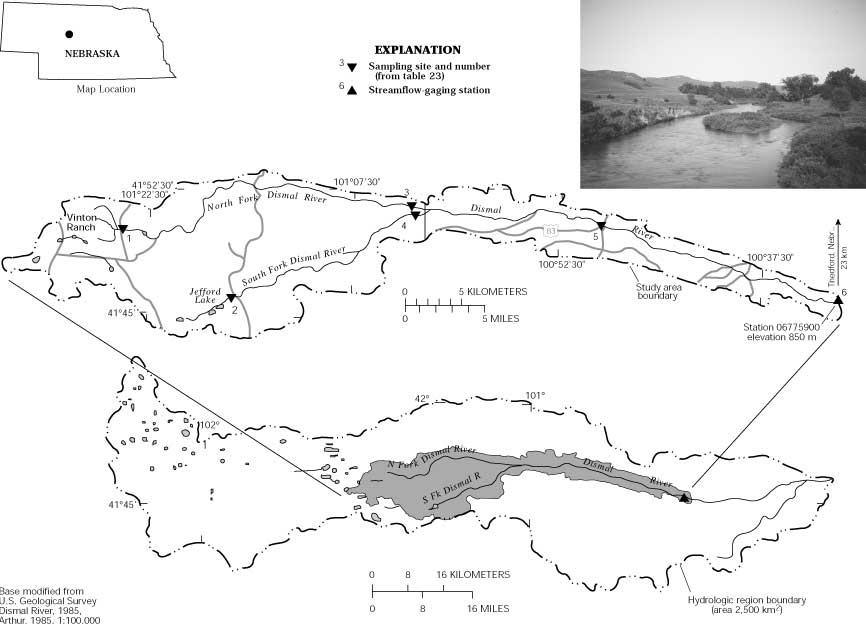
The Dismal River HBN Basin is in the High Plains Section of the Great Plains physiographic province (Fenneman, 1946) in north-central Nebraska (Figure 11. Map showing study area in Dismal River Basin and hydrologic region boundary and photograph of the Dismal River downstream from the stream flow gaging station ). The ecoregion of the basin is classified as the Great Plains Steppe Province (Bailey, 1995). The HBN station is 23 km
 |
Infiltration rates in the sand are high, allowing little surface runoff. Flow in the Dismal River is due almost entirely to ground-water discharge through seeps, springs, and boiling springs (Cornwell, 1990). Boiling sand springs result from vertical ground-water conduits (Guhman and Pederson, 1992). Conduits up to 10 m in diameter and 44 m deep are developed in alluvium. Flow characteristics are nearly uniform throughout the year, and mean monthly discharges only range from 5.4 m³/s in August to 5.9 m³/s in April (Boohar and others, 1996). Average annual precipitation at the Halsey 2W weather station, about 27 km southeast of the HBN station, is about 54 cm. Most of the precipitation falls during brief thunderstorms in spring and summer. The climate is characterized by cold winters to warm summers; mean monthly temperatures ranged from -5.4×C in January to 23.7×C in July during the period 1903-89 (National Climatic Data Center, 1996).
The vegetation of the Dismal River Basin is typical of the Sand Hills prairie. Whereas the Sand Hills prairie is less diverse than some grassland areas, it is unusually diverse for having such sandy soils. The Sand Hills prairie contains tallgrass species, shortgrass species, sedges, and forbs. The most widespread plant community, the bunchgrass community, is characteristic of the dunes (Bleed and Flowerday, 1990). The most common bunchgrass, little bluestem, is the State grass of Nebraska. Deciduous trees grow along the banks of the streams, and some windbreak trees have been planted. Interdunal valleys may contain meadow and marsh plant communities.
Several geologic processes have operated in the Sand Hills region (Ahlbrandt and others, 1980). Cretaceous
 |
The Dismal River HBN station is in Thomas County. Land ownership within the Dismal River Basin is entirely private upstream from the HBN station (Will Boyer, Upper Loup Natural Resources District, written commun., 1996). Just downstream from the station, the Nebraska National Forest borders the north side of the river for about 26 km. The station is accessed from U.S. Highway 83. Other roads in the basin generally are unimproved four-wheel-drive roads. The basin is accessible year round, weather permitting. Land cover is essentially 100 percent rangeland; grazing by cattle is the predominant land use and has continued throughout the study period. There are private residences in the basin; a slight increase in the residential population may have occurred since 1960. A small part of the upper basin is subirrigated rangeland that is used occasionally for hay production (Will Boyer, Upper Loup Natural Resources District, written commun., 1996). Recreational use of the Dismal River includes canoeing, camping, and fishing. One golf course is developed on the high sandy hills.
The data set analyzed for the Dismal River HBN station includes 166 water-quality samples that were collected from December 1966 to August 1995. Sampling frequency is described on the basis of water year, which begins on October 1 and ends on September 30. Sampling frequency was monthly during the early part of the record, 1968-70. Sampling frequency generally was bimonthly during the period 1971-82. For the rest of the period, sampling frequency generally was quarterly. Samples were analyzed at USGS district water-quality laboratories until the early 1970's. After 1973, with the creation of the USGS Central Laboratory System, all samples were analyzed at the water-quality laboratory (now called NWQL) in Arvada, Colo. The period of record for discharge is from water year 1967 to current year (2000).
 |
Data quality was checked using ion balances and time-series plots. Calculated ion balances for samples with complete major-ion analyses are shown in Figures 12a and 12b. Temporal variation of discharge, field pH, major dissolved constituents, and ion balance at Dismal River, Nebraska. About 95 percent of the samples had ion balances within the ±5 percent range, indicating that the major-ion analytical results generally were of good quality and that unmeasured constituents, such as organic anions, nutrients, and trace metals, do not contribute substantially to the ion composition of the stream water. Time-series plots of ion concentrations were inspected for evidence of influences that are related to analytical method changes (fig. 12). Magnesium and sodium show a similar pattern of having more scatter in the early part of the record and a decrease in scatter after 1983. This decrease coincides with a change in the analytical method for these analytes from AA spectroscopy to ICP spectroscopy (U.S. Geological Survey Office of Water Quality Technical Memorandum No. 82.18, 1982). The decrease in scatter of dissolved sulfate after 1982 corresponds with the change from a methylthymol blue procedure to a turbidimetric titration method (U.S. Geological Survey Office of Water Quality Technical Memorandum No. 83.07, 1983). The further decrease in the scatter of dissolved sulfate concentrations after 1990 corresponds with the change from turbidimetric titration to an ion-exchange chromatography analytical method (U.S. Geological Survey Office of Water Quality Technical Memorandum No. 90.04, 1989; U.S. Geological Survey Office of Water Quality Technical Memorandum No. 90.13, 1990). Several temporal trends also were evident in the field pH values. Changes in field meters and electrodes used for field pH determinations also occurred during the study period. When changes in methods or instrumentation result in improved precision or elimination of measurement bias, time-series data can exhibit less scatter or a directional shift, respectively. The time-series data, therefore, may reflect the method or instrument change rather than an environmental change.
The median and range of major-ion concentrations in the stream water collected at the Dismal River HBN station and VWM concentrations in wet precipitation measured at the North Platte Agriculture Experimental Station NADP station are presented in table 20. The precipitation station is about 84 km southwest of the HBN station. Precipitation chemistry at the NADP station was dilute and slightly acidic with VWM pH of 5.6 during the period of record, 1985-95. The dominant cation in precipitation was ammonium, which contributed about 56 percent of cation concentration. This concentration and percentage were higher than at most NADP stations near HBN sites. The dominant anions in precipitation were sulfate and nitrate, which contributed 47 and 46 percent, respectively, of the total anion concentration. Ammonium concentrations in precipitation are highest across the middle part of the United States (National Atmospheric Deposition Program/National Trends Network, 1996), in agricultural areas where nitrogen sources, including livestock waste and fertilizer applications, are widespread. However, precipitation only contributes about 6 percent of the annual nitrogen input to central Nebraska basins compared to about 93 percent from waste and fertilizer sources (Boyd, 1996).
[Parameters in units of microequivalents per liter, except for discharge in cubic meters per second, specific conductance in microsiemens per centimeter at 25 degrees Celsius, pH in standard units, and silica in micromoles per liter; n, number of stream samples; VWM, volume-weighted mean; spec. cond., specific conductance; --, not reported; <, less than]
|
Parameter |
Stream Water |
Precipitation VWM |
|||||
|
Minimum |
First quartile |
Median |
Third quartile |
Maximum |
n |
||
| Discharge |
5.0 |
5.4 |
5.6 |
5.8 |
8.9 |
165 |
-- |
| Spec. cond., field |
148 |
174 |
178 |
182 |
218 |
166 |
-- |
| pH, field |
6.8 |
7.5 |
7.7 |
8.1 |
8.5 |
165 |
5.6a |
| Calcium |
950 |
1,100 |
1,200 |
1,200 |
1,300 |
165 |
12 |
| Magnesium |
140 |
260 |
270 |
290 |
380 |
164 |
1.9 |
| Sodium |
260 |
300 |
300 |
310 |
430 |
159 |
2.5 |
| Potassium |
82 |
130 |
130 |
130 |
240 |
159 |
1.0 |
| Ammonium |
<.7 |
<.7 |
1.4 |
3.6 |
14 |
66 |
25 |
| Alkalinity, laboratory |
1,400 |
1,600 |
1,600 |
1,700 |
1,900 |
164 |
-- |
| Sulfate |
25 |
130 |
150 |
160 |
250 |
160 |
18 |
| Chloride |
8.5 |
22 |
25 |
34 |
84 |
164 |
2.2 |
| Nitrite plus nitrate |
11 |
27 |
31 |
36 |
48 |
104 |
17b |
| Silica |
710 |
890 |
900 |
920 |
1,000 |
158 |
-- |
a Laboratory pH.
b Nitrate only.
Stream water in the Dismal River is a buffered, calcium bicarbonate type. The sum of ion concentrations ranged from about 3,400 to about 4,200 meq/L. Alkalinity ranged from 1,400 to 1,900 meq/L, and bicarbonate was the
 |
Correlations among dissolved constituents and discharge were determined for the Dismal River (table 21). The base cations and anions showed weak and mixed, positive and inverse relations with discharge; rho values range from -0.335 (silica) to 0.322 (pH). The discharge is not highly variable in this basin, and most of the water is derived from ground water. Surficial runoff containing low dissolved solids does not typically occur in the basin, and dilution effects from precipitation are not observed in the ion-discharge relations. Positive, but weak, correlations existed among base ions. The strongest correlation was between calcium and magnesium (rho value = 0.489). The weak relations in stream water may reflect contributions from varying ground-water sources (Gilbert and Pederson, 1988).
[Q, discharge; Ca, calcium; Mg, magnesium; Na, sodium; K, potassium; Alk, alkalinity; SO4, sulfate; Cl, chloride; SiO2, silica; --, not applicable]
|
|
Q |
pH |
Ca |
Mg |
Na |
K |
Alk |
SO4 |
Cl |
| pH |
0.322 |
-- |
-- |
-- |
-- |
-- |
-- |
-- |
-- |
| Ca |
.107 |
0.165 |
-- |
-- |
-- |
-- |
-- |
-- |
-- |
| Mg |
.248 |
.066 |
0.489 |
-- |
-- |
-- |
-- |
-- |
-- |
| Na |
-.013 |
.077 |
.211 |
.322 |
-- |
-- |
-- |
-- |
-- |
| K |
.055 |
.057 |
.355 |
.393 |
.232 |
-- |
-- |
-- |
-- |
| Alk |
.158 |
.249 |
.407 |
.326 |
.317 |
0.431 |
-- |
-- |
-- |
| SO4 |
-.074 |
-.450 |
-.025 |
.126 |
-.041 |
-.108 |
-0.210 |
-- |
-- |
| Cl |
.198 |
-.039 |
.298 |
.336 |
.327 |
.279 |
.206 |
0.169 |
-- |
| SiO2 |
-.335 |
-.055 |
.121 |
-.084 |
.044 |
.024 |
-.166 |
-.109 |
-0.258 |
Results of the seasonal Kendall test for trends in discharge and major dissolved constituents for the Dismal River from 1967 through 1995 are presented in table 22. A significant upward trend was observed in discharge. The trend in discharge is only representative of instantaneous measurements made during water-quality sampling and may not correspond with a trend in the continuous discharge record. The only significant trends (a = 0.01) observed in the chemical data were a downward trend in unadjusted sulfate concentrations and upward trends in unadjusted and flow-adjusted pH. The flow-adjustment model was not significant and did not calculate trends for most of the chemical constituents. This is probably because of the small range of discharges at this HBN station produced by the ground-water dominated flows. The increase in pH and decrease in sulfate concentrations reverses the trends determined by Smith and Alexander (1983) at this station. For the study period from the late 1960's to 1981, significant increases (a = 0.01) were observed in sulfate, and a corresponding significant decrease was observed in pH and alkalinity. Sulfur-dioxide emissions in Nebraska increased by 38 percent during the period 1975-84 (Lins, 1987). Significant decreases in emissions, however, were observed in most of the other Midwestern and Northeastern States for this period. Concentrations of sulfate, hydrogen, and nitrate decreased in precipitation chemistry at a Nebraska NADP station for the period 1980-92 (Lynch and others, 1995).
[Trends in units of microequivalents per liter per year, except for discharge in cubic meters per second per year, pH in standard units per year, and silica is in micromoles per liter per year; p-value, attained significance level; --, not calculated; <, less than]
|
Parameter |
Unadjusted |
Flow adjusted |
||
|
Trend |
p-value |
Trend |
p-value |
|
| Discharge |
0.9 |
<0.001 |
-- |
-- |
| pH |
.02 |
<.001 |
0.01 |
<0.001 |
| Calcium |
<.01 |
.750 |
(a) |
-- |
| Magnesium |
<.01 |
.361 |
(a) |
-- |
| Sodium |
<.01 |
.396 |
(a) |
-- |
| Potassium |
<.01 |
.080 |
-.01 |
.816 |
| Alkalinity |
<.01 |
.149 |
(a) |
-- |
| Sulfate |
-1 |
.009 |
(a) |
-- |
| Chloride |
-.1 |
.096 |
(a) |
-- |
| Nitrite plus nitrate |
.1 |
.040 |
(a) |
-- |
| Silica |
<.01 |
.054 |
-.3 |
.459 |
a Concentration-flow model not significant at a = 0.10.
Results of a surface-water synoptic sampling conducted August 17 and 18, 1992, in the Dismal River Basin are presented in table 23, and locations of the sampling sites are shown in figure 11. Discharge at the HBN station (site 6) was 5.9 m³/s compared to the mean monthly discharge of 5.4 m³/s for the month of August (Boohar and others, 1996). The largest increase in discharge occurred between the confluence of the North and South Forks (sites 3 and 4) and site 5. This reach of the Dismal River receives ground-water inputs from the boiling springs (Guhman and Pederson, 1992).
[Site locations shown in fig. 11.; Q, discharge in cubic meters per second; SC, specific conductance in microsiemens per centimeter at 25 degrees Celsius; pH in standard units; Ca, calcium; Mg, magnesium; Na, sodium; K, potassium; Alk, alkalinity; SO4, sulfate; Cl, chloride; NO3, nitrate; SiO2, silica; concentrations in microequivalents per liter, except silica is in micromoles per liter; --, not measured; <, less than; criteria used in selection of sampling sites: BG = bedrock geology, TRIB = major tributary]
|
Site |
Identification number |
Q |
SC |
pH |
Ca |
Mg |
Na |
K |
Alk |
SO4 |
Cl |
NO3 |
SiO2 |
Criteria |
|
1 |
414933101244300 |
0.01 |
320 |
7.9 |
1,900 |
620 |
700 |
130 |
3,300 |
25 |
34 |
0.4 |
730 |
BG |
|
2 |
414532101165800 |
.02 |
247 |
9.4 |
1,100 |
580 |
870 |
64 |
2,500 |
8.3 |
28 |
<.4 |
800 |
BG |
|
3 |
415112101021600 |
1.5 |
219 |
8.1 |
1,300 |
350 |
400 |
150 |
2,000 |
160 |
14 |
15 |
770 |
TRIB |
|
4 |
415104101021600 |
1.1 |
182 |
8.0 |
1,100 |
270 |
360 |
150 |
1,700 |
110 |
23 |
31 |
680 |
TRIB |
|
5 |
415042100492700 |
5.3 |
181 |
8.3 |
1,000 |
260 |
300 |
62 |
1,700 |
120 |
14 |
27 |
830 |
BG |
|
6 |
06775900 |
5.9 |
175 |
8.2 |
1,000 |
250 |
280 |
120 |
1,600 |
120 |
17 |
27 |
1,000 |
TRIB |
All sites in the basin had a water type of calcium bicarbonate. During the synoptic sampling, the sums of ions at all sites upstream from the HBN station (site 6) were higher than the sum of ions at the HBN station (3,400 meq/L) and ranged from 3,500 meq/L (site 5) to 6,700 meq/L (site 1). The concentrations of major ions at most sites in the upper basin on both the North Fork (sites 1 and 3) and South Fork (site 2) were higher than typically were measured at the HBN station for the period of record, 1967-95 (table 20). Concentrations in samples that were collected at the site in the lower basin (site 5) and at the HBN station (site 6) were generally near median values for the period of record. Concentrations of ions in waters of the Sand Hills generally are lower than other waters in Nebraska. This is attributed to the alkaline waters and their lower potential to dissolve minerals from rocks (Bleed and Flowerday, 1990) and the lack of weatherable minerals in underlying sands. The highest pH (9.4) was measured at site 2 and is characteristic of the strongly alkaline waters in the Sand Hills region. Silica concentrations were high in all samples and account for a significant portion of the dissolved solids. The percentage of silica was as high as about 30 percent of the dissolved solids at site 6. Nitrate concentrations generally increased from upstream to downstream, from <0.4 meq/L (site 2) to 27 meq/L (site 6); however, the highest nitrate concentration was 31 meq/L, measured at site 4. This indicates that land use may be affecting nitrate concentrations in the basin, although concentrations at all sites were still much lower than other streams in Nebraska (Boyd, 1996). The nature of sandy soils also may transport nitrate faster than it can be assimilated by the plant communities.
Ahlbrandt, T.S., Fryberger, S.G., Hanley, J.H., and Bradbury, J.P., 1980, Geologic and paleoecologic studies of the Nebraska Sand Hills: U.S. Geological Survey Professional Paper 112-A, B, C.
Bailey, Robert G., 1995, Descriptions of the ecoregions of the United States: U.S. Department of Agriculture, Forest Service, Miscellaneous Publication 1391, 108 p.
Bleed, Ann, and Flowerday, Charles, eds., 1990, An atlas of the Sand Hills: University of Nebraska-Lincoln, Resource Atlas 5a, 265 p.
Boohar, J.A., Hoy, C.G., and Jelinek, F.J., 1996, Water resources data, Nebraska, water year 1995: U.S. Geological Survey Water-Data Report NE-95-1, 320 p.
Boyd, R.A., 1996, Distribution of nitrate and orthophosphate in selected streams in central Nebraska: Water Resources Bulletin, December 1996, v. 32, no. 6, p. 1247-1257.
Cornwell, Kevin, 1990, Variations in flow of the Dismal River in north central Nebraska as related to atmospheric pressure changes: American Geophysical Union, EOS, 1990 Fall Meeting Proceedings, San Francisco, California, p. 1327.
Fenneman, N.M., 1946, Physical divisions of the United States: Washington, D.C., U.S. Geological Survey special map, scale 1:7,000,000.
Gilbert, J.A., and Pederson, D.T., 1988, Water quality study of boiling springs along the Dismal River in the Sand Hills of Nebraska: American Geophysical Union 1988 Fall Meeting Proceedings, EOS, v. 69, no. 44, p. 1186.
Guhman, A.I., and Pederson, D.T., 1992, Boiling sand springs, Dismal River, Nebraska-Agents for formation of vertical cylindrical structures and geomorphic change: Geology, v. 20, January 1992, p. 8-10.
Lins, H.F., 1987, Trend analysis of monthly sulfur dioxide emissions in the conterminous United States, 1975-1984: Atmospheric Environment, v. 21, no.11, p. 2297-2309.
Lynch, J.A., Bowersox, V.C., and Grimm, J.W., 1995, Trends in precipitation chemistry in the United States-A national perspective, 1980-92: Atmospheric Environment, v. 29, no. 11. p. 1231-1246.
National Atmospheric Deposition Program/National Trends Network, 1996, NADP/NTN Wet deposition in the United States, 1995: Fort Collins, Colorado State University, Natural Resource Ecology Laboratory, 10 p.
National Climatic Data Center, 1996, Summary of the day, CD-ROM: Boulder, Colorado, EarthInfo Incorporated.
Smith, R.A., and Alexander, R.B., 1983, Evidence for acid-precipitation-induced trends in stream chemistry at hydrologic benchmark stations: U.S. Geological Survey Circular 910, 12 p.
U.S. Geological Survey, 1982, Program and plan-National water-quality networks FY1983: Office of Water Quality Technical Memorandum No. 82.18, accessed December 27, 1999, at URL http://water.usgs.gov/ admin/memo/
U.S. Geological Survey, 1983, Analytical methods-Sulfate determinations: Office of Water Quality Technical Memorandum No. 83.07, accessed December 27, 1999, at URL http://water.usgs.gov/admin/memo/
U.S. Geological Survey, 1990, Programs and plans-National water-quality networks FY1991: Office of Water Quality Technical Memorandum No. 90.13, accessed December 27, 1999, at URL http://water.usgs.gov/admin/memo/
a. U.S. Geological Survey topographic maps:
b. Geologic maps:
c. Soil surveys:
Table B-1. NWIS site-identification numbers and site names for water-quality sampling sites.
|
Site |
Identification Number |
Site Name |
|
1 |
414933101244300 |
North Fork Dismal River near Vinton Ranch |
|
2 |
414532101165800 |
South Fork Dismal River below Jefford Lake |
|
3 |
415112101021600 |
North Fork Dismal River |
|
4 |
415104101021600 |
South Fork Dismal River |
|
5 |
415042100492700 |
Dismal River three miles above gage |
|
6 |
06775900 |
Dismal River near Thedford, Nebraska |
| Back to 1173-C Contents |
This page maintained by Nichole Bisceglia.
Last updated July 31, 2000.