
Hydrologic Benchmark Network Stations in the Western U.S. 1963-95 (USGS Circular 1173-D)
To download a printer friendly PDF version of this information click here.
This report details one of the approximately 50 stations in the Hydrologic Benchmark Network (HBN) described in the four-volume U.S. Geological Survey Circular 1173. The suggested citation for the information on this page is:
|
Mast, M.A., and Clow, David W., 2000, Environmental characteristics and water-quality of Hydrologic Benchmark Network stations in the Western United States, U.S. Geological Survey Circular 1173-D, 115 p. |
All of the tables and figures are numbered as they appear in each circular. Use the navigation bar above to view the abstract, introduction and methods for the entire circular, as well as a map and list of all of the HBN sites. Use the table of contents below to view the information on this particular station.
|
Table of Contents |
| 1. Site Characteristics and Land Use |
| 2. Historical Water Quality Data and Time-Series Trends |
| 3. Synoptic Water Quality Data |
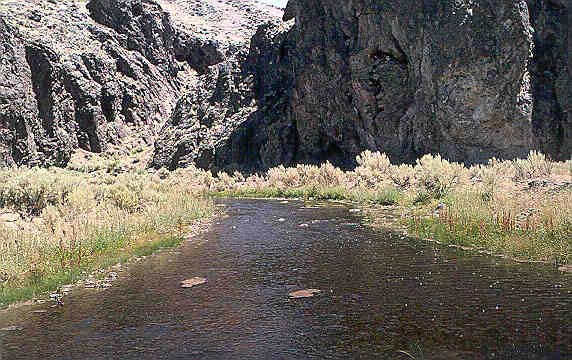
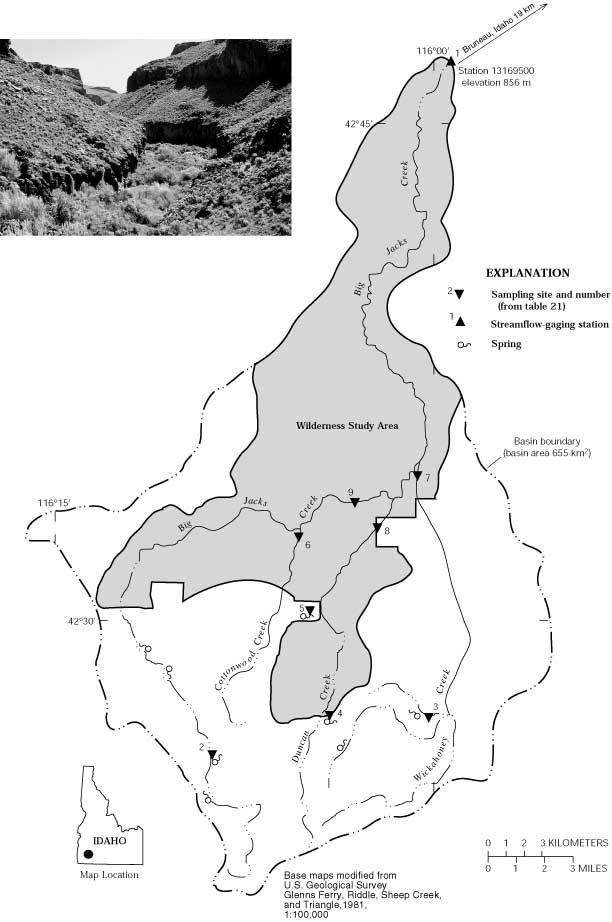
The Big Jacks Creek HBN Basin is located in the Columbia Plateaus physiographic province in southwestern Idaho (Figure 10. Map showing the study area in the Big Jacks Creek Basin and photograph showing the main canyon). The 655-km² basin ranges in elevation from 856 to 1,790 m and drains a sagebrush-covered plateau dissected by rugged, sheer-walled canyons that
 |
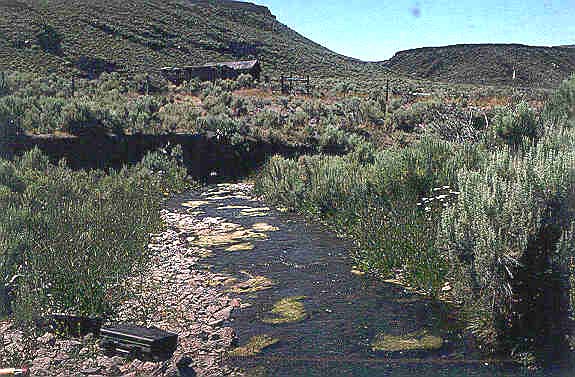
The basin is in the Intermountain Sagebrush ecoregion (Bailey and others, 1994) and is covered by big sagebrush, low sagebrush, salt desert shrub, and riparian vegetation communities (U.S. Department of the Interior, 1989). The sagebrush communities are most common; low sagebrush types are found primarily on shallow, poorly drained soil, and big sagebrush types are associated with deep, well-drained soils. The big sagebrush community is dominated by Wyoming big sagebrush and bluebunch wheatgrass, and the low sagebrush community is dominated by black sagebrush, low sagebrush, Thurber needlegrass, Idaho fescue, and bluebunch wheatgrass. The salt desert shrub type grows on poorly developed soils in northern part of the basin and consists of shadescale, bud sagebrush, and Indian ricegrass. Lush riparian vegetation grows along perennial reaches of the creek and generally includes shrubs of willow, rose, and currant as well as sedge and bluegrass in meadow areas. Most soils in the basin are classified as Aridisols and are mapped in the Cottle-Willhill complex (Noe, 1991). These are well-drained, shallow soils developed in alluvium and residuum derived from volcanic rocks. Soil textures are predominantly gravelly clay loam, and most soils contain 35 to 70 percent rock fragments. The soils are alkaline (soil pH 7.4 to 8.4), contain less than 2 percent organic matter, and range in depth from 25 to 80 cm (Noe, 1991).
The basin is in the Owyhee Uplands sub-province of the Columbia Intermontane geologic province, informally known as the Owyhee volcanic field (Winters and Leszcykowski, 1986). Bedrock underlying the basin consists of several ledge-forming rhyolite units of Miocene age capped by younger basalt flows (Kauffman and Bonnichsen, 1990). Most of the rhyolite units
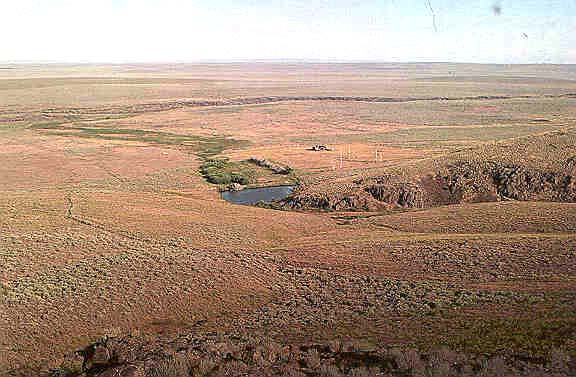 |
The Big Jacks Creek HBN Basin drains the southwestern part of Owyhee County, Idaho, and land ownership is about 92 percent Federal, 7 percent State, and 1 percent private. Federally owned lands are managed by the Bureau of Land Management (BLM), of which about 40 percent (260 km²) in the northern one-half of the basin is in the Big Jacks Creek and Duncan Creek Wilderness Study Areas (WSA), which were established in 1976 (fig. 10). Access to the basin is by way of a network of dirt roads in the southern part of the basin and mostly hiking trails in the WSA. Lands in the WSA have been identified as meeting the requirements of wilderness under the Wilderness Act (Public Law 88-577, Sept. 3, 1964) and, although designation has not yet been granted, the BLM is required to manage the lands to protect their wilderness characteristics (U.S. Department of the Interior, 1989). The major land-use activities in the WSA are recreation and livestock grazing. Visitor use of the WSA is about 1,125 annual visitor days, and hunting accounts for about 80 percent of this use (U.S.Departmet of the Interior, 1989). The WSA contains parts of four grazing allotments that are used primarily for cattle. The grazing season begins during the spring in the northern part of the WSA and moves to the southern parts during summer and fall. Although the amount of cattle grazing has not changed substantially since the establishment of the WSA, improved management practices have decreased grazing pressures on the ecosystem, particularly in riparian areas. Some prescribed burning is permitted in the WSA to improve range conditions and control juniper invasion (U.S. Department of the Interior, 1989). The primary land use in nonwilderness areas of the basin is cattle grazing, and effects from grazing are most pronounced in the vicinity of springs and several small reservoirs in the northern part of the basin.
The data set for the Big Jacks Creek HBN station analyzed for this report includes 111 water-quality samples that were collected from January 1967 through November 1995. Sampling was scheduled as monthly from 1967 to 1982 and quarterly from 1983 to 1995; however, the actual number of samples collected was considerably lower because of the intermittent nature of the stream. Samples from the early part of the period of record were analyzed at a USGS district
 |
Calculated ion balances for 109 samples that have complete major-ion analyses are shown in figures 11a and 11b. Graphs showing temporal variation of discharge, field pH, major-ion concentrations, and ion balance in Big Jacks Creek, Idaho. Ion balances ranged from -28 to +20 percent, and 80 percent of the samples had values within the ±5-percent range, indicating that the analytical results are of high quality. The average ion balance was -0.2 percent, indicating that unmeasured constituents, such as organic anions, generally are not an important component of stream water at this HBN station. Time-series plots of the major dissolved constituents were inspected for evidence of method-related effects (fig. 11). The most notable pattern was observed in sulfate, which had a period of high concentrations during the late 1980's, coinciding with the use of a turbidimetric titration for sulfate analyses at the NWQL (Fishman and others, 1994). In 1990, the NWQL determined that sulfate concentrations can be overestimated by this technique and changed the technique to ion chromatography (Office of Water Quality Technical Memorandum No. 90.04, Turbidimetric sulfate method, issued December 21, 1989, at URL http://water.usgs.gov/admin/memo/). The stepped pattern in concentrations of nitrite plus nitrate was caused by changes in the analytical reporting limit for this constituent that occurred in 1982 and again in 1991.
[Concentrations in units of microequivalents per liter, discharge in cubic meters per second, specific conductance in microsiemens per centimeter at 25 degrees Celsius, pH in standard units, and silica in micromoles per liter; n, number of stream samples; VMW, volume-weighted mean; inst., instantaneous; spec. cond., specific conductance; <, less than; --, not reported]
| Parameter | Stream Water | Precipitation VMAa | |||||
| Minimum | First Quartile | Median | Third Quartile | Maximum | n | ||
| Discarge, inst. | 0.0020 | 0.047 | 0.13 | 0.33 | 6.5 | 111 | -- |
| Spec. cond., field | 66 | 120 | 140 | 150 | 190 | 110 | 5.2 |
| pH, field | 6.4 | 7.7 | 8.2 | 8.6 | 9.5 | 110 | 5.6b |
| Calcium | 310 | 500 | 600 | 650 | 950 | 111 | 8.0 |
| Magnesium | 110 | 210 | 230 | 260 | 350 | 111 | 1.9 |
| Sodium | 170 | 440 | 480 | 520 | 700 | 110 | 0.7 |
| Potassium | 72 | 90 | 97 | 110 | 170 | 109 | 6.9 |
| Ammonium | <.7 | <1.1 | 2.9 | 5.0 | 12 | 41 | 9.3 |
| Alkalinity, laboratory | 420 | 960 | 1,120 | 1,270 | 1,760 | 111 | -- |
| Sulfate | 6 | 120 | 150 | 180 | 290 | 111 | 8.6 |
| Chloride | 39 | 110 | 130 | 160 | 210 | 111 | 3.4 |
| Nitrite plus nitrate | <.7 | 3.6 | 7.1 | 11 | 86 | 90 | 8.7c |
| Silica | 55 | 530 | 600 | 610 | 700 | 109 | 2.5 |
a Values are volume-weighted mean concentrations for 1983-95.
b Laboratory pH.
c Nitrate only.
The median concentrations and ranges of major dissolved constituents in stream water collected at the HBN station and VWM concentrations in wet-only precipitation measured at the Reynolds Creek NADP station are presented in table 18. Precipitation chemistry at the NADP station, which is about 80 km northwest of the HBN station, is very dilute and slightly acidic and had a VWM pH of 5.6 for 13 years of record. The predominant cations in precipitation were calcium and ammonium, which contributed 27 and 32 percent of the total cation charge, respectively. The predominant anions were sulfate and nitrate, which each accounted for 42 percent of the total anion charge, respectively.
Stream water in Big Jacks Creek is moderately concentrated and well buffered; specific conductance ranged from 66 to 190 mS/cm, and alkalinity ranged from 420 to 1,760 meq/L (table 18). The major cations in stream water were calcium and sodium, and the major anion was bicarbonate. The predominance of these solutes in stream water, in addition to the high concentrations of potassium and silica, are attributed to the weathering of plagioclase, pyroxene, and olivine minerals in the
 |
The solute composition of stream water was further evaluated by analyzing correlations between solutes and stream discharge (table 19). Most weathering-derived solutes had strong inverse correlations with stream discharge, particularly sodium (rho = -0.759) and alkalinity (rho = -0.673). These results are consistent with a hydrologic system where weathering-enriched base flow is diluted by water from shallow or surficial sources during periods of increased discharge, particularly spring snowmelt. For the solutes, the strongest correlations were among calcium, magnesium, sodium, alkalinity, and silica, which is consistent with the weathering stoichiometry of silicate minerals in the volcanic bedrock. Chloride was positively correlated with the major cations, and with sulfate (0.561 < rho < 0.599) but was only weakly correlated with alkalinity (rho = 0.334) and silica (rho = 0.279). The moderately strong correlation between sulfate and chloride (rho = 0.599) indicates a common source of these solutes, such as thermal ground water that is discharged from springs along the canyon floor (Berenbrock, 1993).
[Q, discharge; Ca, calcium; Mg, magnesium; Na, sodium; K, potassium; Alk, alkalinity; SO4, sulfate; Cl, chloride; Si, silica]
|
|
|
|
|
|
|
|
|
|
|
| pH | -0.339 | -- | -- | -- | -- | -- | -- | -- | -- |
| Ca | -.616 | 0.449 | -- | -- | -- | -- | -- | -- | -- |
| Mg | -.545 | .477 | 0.759 | -- | -- | -- | -- | -- | -- |
| Na | -.759 | .488 | .823 | .0790 | -- | -- | -- | -- | -- |
| K | -.504 | .268 | .508 | .396 | 0.490 | -- | -- | -- | -- |
| Alk | -.673 | .529 | .754 | .733 | .762 | 0.524 | -- | -- | -- |
| SO4 | -.067 | .119 | .332 | .347 | .270 | -.065 | 0.154 | -- | -- |
| Cl | -.287 | .341 | .561 | .592 | .527 | .097 | .334 | 0.599 | -- |
| Si | -.447 | .484 | .604 | .594 | .657 | .410 | .623 | .061 | .279 |
[Trends in units of microequivalents per liter per year, except for discharge in cubic meters per second per year, pH in standard units per year, and silica in micromoles per liter per year; <, less than; --, not calculated]
| Parameter |
Unadjusted
|
Flow adjusted
|
||
|
Trend
|
p-value
|
Trend
|
p-value
|
|
| Discharge |
-0.002
|
0.420
|
--
|
--
|
| pH, field |
.03
|
.005
|
0.02
|
0.184
|
| Calcium |
3.3
|
.016
|
4.1
|
.015
|
| Magnesium |
1.2
|
.102
|
1.1
|
.036
|
| Sodium |
3.6
|
.001
|
3.8
|
.000
|
| Potassium |
-.1
|
.475
|
-.3
|
.132
|
|
Alkalinity, laboratory
|
1.3
|
.819
|
-.5
|
.819
|
| Sulfate |
1.7
|
.070
|
1.7
|
.068
|
| Chloride |
2.6
|
.000
|
2.7
|
.000
|
| Nitrite plus nitrate |
(a)
|
--
|
--
|
--
|
| Silica |
1.8
|
.033
|
2.1
|
.055
|
a Insufficient data to calculate trend
The results of the seasonal Kendall test for trends in discharge and major dissolved constituents are listed in table 20. Statistically significant upward trends were detected in unadjusted sodium and chloride concentrations and in field pH at the 0.01 probability level. Trends were similar for the unadjusted and flow-adjusted sodium and chloride concentrations; however, the trend in flow-adjusted pH was not statistically significant, indicating that the pH trend probably is related to variations in stream discharge. The LOWESS curves in figure 11 show somewhat different temporal patterns in the sodium and chloride concentrations during the period of record. For example, the increase in sodium concentrations was nearly constant during the period of record, whereas chloride concentrations increased until the late 1980's then declined slightly through the 1990's. A possible explanation for the decrease in chloride concentrations in the 1990's was a change in the analytical technique from colorimetry to ion chromatography in 1990 (Fishman and others, 1994). The cause of the upward trends in sodium and chloride concentrations prior to 1990 could not be identified but they probably are not related to changes in atmospheric deposition, considering the dilute chemistry of precipitation at the NADP station compared to the stream (table 18). Other environmental factors that may have caused changes in stream-water chemistry include changes in land use and possibly discharge from geothermal springs. Grazing is the major land use in the basin; however, livestock use has not changed substantially during the period of record, particularly since the establishment of the WSA in 1976. Discharge from geothermal springs in a nearby drainage has declined during the past 25 years in response to removal of water from the regional geothermal aquifer for irrigation (Berenbrock, 1993). Assuming geothermal springs are present in the basin and are enriched in chloride and sodium compared to stream water (Young and Lewis, 1982), similar declines in spring discharge in Big Jacks Creek would not provide a reasonable explanation for the upward trends in chloride and sodium at this HBN station.
Chemical results of the surface-water synoptic sampling of July 9-11, 1993, are listed in table 21, and locations of sampling sites are shown in figure 10. During the synoptic sampling, discharge at the HBN station was 0.12 m³/s compared to the monthly mean discharge of 0.04 m³/s for July (Brennan and others, 1996), indicating that the basin was sampled at nearly normal flow conditions for that time of year. Most of the solute concentrations measured at the HBN station (site 1) during the synoptic sampling were close or equal to the third-quartile values reported for the station during the entire period of record, except for sulfate and chloride concentrations, which were substantially lower (table 18). The concentrations of the base cations and alkalinity in the tributary streams were lower than the concentrations measured at site 1, except for site 4. Ion balances for all the synoptic samples were positive (ranging from 0.1 to 5.5 percent), indicating that unmeasured constituents. such as organic anions, may have contributed slightly to the ionic content of stream water during the synoptic sampling. In general, concentrations of the major solutes did not vary markedly among the sampling sites, probably because of the nearly uniform composition of the volcanic bedrock.
[Site locations shown in fig. 10; Q, discharge in cubic meters per second; SC, specific conductance in microsiemens per centimeter at 25 degrees Celsius; pH in standard units; Ca, calcium; Mg, magnesium; Na, sodium; K, potassium: Alk, alkalinity; SO4, sulfate; Cl, chloride; NO3, nitrate; Si, silica; concentrations in microequivalents per liter, except silica in micromoles per liter; <, less than; --, not reported]
| Site | Station number | Q | SC | pH | Ca | Mg | Na | K | Alk | S04 | Cl | NO3 | Si | Criteriaa | Remarks |
| 1 | 13169500 |
0.12
|
160
|
9.2 |
650
|
260
|
570
|
100
|
1,320
|
83
|
110
|
<0.4
|
670
|
--
|
-- |
| 2 | 422612116081200 |
--
|
78
|
7.6 |
310
|
100
|
280
|
24
|
620
|
40
|
51
|
0.6
|
530
|
SP, LU
|
Livestock water source |
| 3 | 422715115591400 | -- | 110 | 7.4 | 480 | 150 | 370 | 59 | 740 | 150 | 140 |
79
|
570 | SP, LU | Livestock water source |
| 4 | 422724116032100 | -- | 180 | 7.6 | 700 | 280 | 610 | 190 | 1,360 | 160 | 170 |
1.4
|
580 | SP,LU | Livestock water source |
| 5 | 423019116040100 | -- | 99 | 7.7 | 410 | 140 | 340 | 67 | 720 | 90 | 87 | 43 | 720 | SP | Livestock water source |
| 6 | 423104116050400 | -- | 98 | 7.7 | 410 | 140 | 350 | 72 | 700 | 90 | 87 | <.4 | 750 | MT | Canyon site |
| 7 | 423231115583700 | .023 | 140 | 9.4 | 600 | 210 | 520 | 77 | 1,120 | 100 | 120 | <.4 | 580 | MT, LU | Livestock grazing |
| 8 | 423259116012800 | .050 | 120 | 8.0 | 500 | 180 | 430 | 79 | 940 | 98 | 99 | <.4 | 730 | MT | Canyon site |
| 9 | 423346116022900 | .28 | 140 | 8.6 | 550 | 210 | 480 | 92 | 1,100 | 98 | 99 |
<0.4
|
800 | MT | Canyon site |
aCriteria used in selection of sampling sites: LU = land use, SP = spring, MT = major tributary.
For example, calcium ranged from 310 to 700 meq/L, alkalinity ranged from 620 to 1,360 meq/L, and silica ranged from 530 to 800 mmol/L (table 21). Of the weathering-derived constituents, potassium had the widest range of concentrations, varying from 24 meq/L at site 2 to 190 meq/L at site 4, perhaps reflecting different ground- water residence times. There was no substantial difference between the chemistry of several headwater springs (sites 2-5) and the chemistry of downstream sampling sites (sites 6-9), supporting the idea that ground-water discharge from upland springs is the primary source of streamflow in the canyon. Sulfate and chloride concentrations were slightly higher at two springs (sites 3 and 4) compared to the other sampling sites, probably reflecting variations in ground-water chemistry. Nitrate concentrations were low (<1.5 meq/L) at all the sampling sites, except for Wickahoney Spring (site 3) and Hicks Spring (site 5), which had concentrations of 79 and 43 meq/L, respectively. Because the springs are used as a water source by cattle, the high nitrate concentrations at these two sites are probably derived from livestock wastes. Nitrate concentrations at sampling sites downstream from the springs (sites 7 and 8) were less than the analytical reporting limit, indicating that the stream biota were capable of utilizing upstream inputs of nitrate.
Bailey, R.G., Avers, P.E., King, T., McNab, W.H., eds., 1994, Ecoregions and subregions of the United States with supplementary table of map unit descriptions: Washington, D.C., U.S. Department of Agriculture, Forest Service, scale 1:7,500,000.
Berenbrock, Charles, 1993, Effects of well discharge on hydraulic heads in and spring discharge from the geothermal aquifer system in the Bruneau area, Owyhee County, southwestern Idaho: U.S. Geological Survey Water- Resources Investigations Report 93-4001, 58 p.
Brennan, T.S., O'Dell, I., Lehmann, A.K., and Tungate, A.M., 1996, Water resources data, Idaho, water year 1995- v. 2, Upper Columbia River Basin and Snake River Basin below King Hill: U.S. Geological Survey Water-Data Report ID-95-2, 357 p.
Durum, W.H., 1978, Historical profile of quality of water laboratories and activities, 1879-1973: U.S. Geological Survey Open-File Report 78-432, 235 p.
Fishman, M.J., Raese, J.W., Gerlitz, C.N., and Husband, R.A., 1994, U.S. Geological Survey approved inorganic and organic methods for the analysis of water and fluvial sediment, 1954-94: U.S. Geological Survey Open-File Report 94-351, 55 p.
Kauffman, D.F., and Bonnichsen, Bill, 1990, Geologic map of the Little Jacks Creek, Big Jacks Creek, and Duncan Creek Wilderness study areas, Owyhee County, Idaho: U.S. Geological Survey Miscellaneous Field Studies Map MF-2142, scale 1:50,000.
National Climatic Data Center, 1997, Summary of the day: Boulder, Colorado, EarthInfo Incorporated, CD-ROM.
Noe, H.R., 1991, Soil survey of Elmore County, Idaho, parts of Elmore, Owyhee, and Ada Counties: Boise, U.S. Department of Agriculture Soil Conservation Service, 500 p.
Slack, J.R., Lumb, A.M., and Landwehr, J.M., 1993, Streamflow data set, 1874-1988: U.S. Geological Survey Water-Resources Investigation Report 93-4076, 1 CD- ROM.
U.S. Department of the Interior, 1989, Jacks Creek Wilderness environmental impact statement: Boise, Idaho, U.S. Department of the Interior, Bureau of Land Management.
Winters, R.A., and Leszcykowski, A.M., 1986, Mineral resources of the Big Jacks Creek study area, Owhyee County, Idaho: Spokane, Wash., U.S. Bureau of Mines Open File Report 49-86, 9 p.
Young, H.W., and Lewis, R.E., 1982, Hydrology and geochemistry of thermal ground water in southwestern Idaho and north-central Nevada: U.S. Geological Survey Professional Paper 1044-J, 20 p.
a. U.S. Geological Survey Topographic Maps:
b. Geologic Maps:
c. Soil Surveys:
d. Miscellaneous Maps:
Table B-1. NWIS site-identification numbers and site names for water-quality sampling sites.
|
|
|
|
| 1 | 13169500 | BIG JACKS CREEK NEAR BRUNEAU, ID |
| 2 | 422612116081200 | BIG JACKS CR SPRING AB RESERVOIR NR BRUNEAU, ID |
| 3 | 422715115591400 | WICKAHONEY SPRING NR BRUNEAU, ID |
| 4 | 422724116032100 | DUNCAN SPRING NR BRUNEAU, ID |
| 5 | 423019116040100 | HICKS SPRING NR BRUNEAU, ID |
| 6 | 423104116050400 | COTTONWOOD CR NR HARVEY PL NR BRUNEAU, ID |
| 7 | 423231115583700 | WICKAHONEY CR NR BRUNEAU, ID |
| 8 | 423259116012800 | DUNCAN CR AT BUNCEL PLACE NR BRUNEAU, ID |
| 9 | 423346116022900 | BIG JACKS CR AT HOLMAN CABIN NR BRUNEAU, ID |
| Back to 1173-D Contents |
This page maintained by Nichole Bisceglia.
Last updated August 2, 2000.