
Hydrologic Benchmark Network Stations in the Western U.S. 1963-95 (USGS Circular 1173-D)
To download a printer friendly PDF version of this information click here.
This report details one of the approximately 50 stations in the Hydrologic Benchmark Network (HBN) described in the four-volume U.S. Geological Survey Circular 1173. The suggested citation for the information on this page is:
|
Mast, M.A., and Clow, David W., 2000, Environmental characteristics and water-quality of Hydrologic Benchmark Network stations in the Western United States, U.S. Geological Survey Circular 1173-D, 115 p. |
All of the tables and figures are numbered as they appear in each circular. Use the navigation bar above to view the abstract, introduction and methods for the entire circular, as well as a map and list of all of the HBN sites. Use the table of contents below to view the information on this particular station.
|
Table of Contents |
| 1. Site Characteristics and Land Use |
| 2. Historical Water Quality Data and Time-Series Trends |
| 3. Synoptic Water Quality Data |
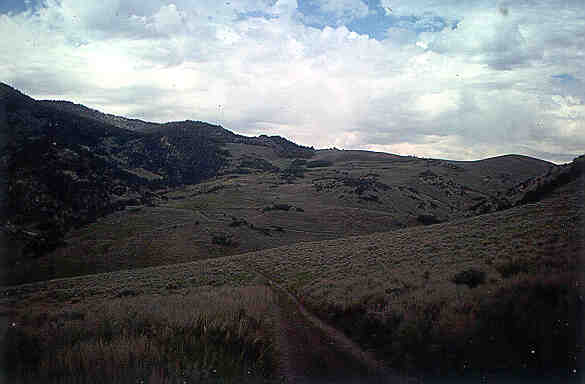
The Steptoe Creek HBN Basin is located in the Basin and Range physiographic province in east-central Nevada (Figure 16. Map showing the study area in the Steptoe Creek Basin and photograph showing the basin landscape). The topography of the area is characterized by north- to northeast-trending mountain ranges separated by long alluviated valleys. The Steptoe
 |
The basin is in the Nevada Mountains Semidesert ecoregion (Bailey and others, 1994), and vegetation is dominated by pinyon-juniper woodlands, mountain scrub communities, and aspen forests (U.S. Department of the Interior, 1992). The pinyon-juniper woodlands are most prevalent on warm, dry sites between 2,070 and 3,050 m and consist of single-needle pinyon pine and Utah juniper that grow in scattered clumps; the ground cover consists of small shrubs, herbs, and grasses. Mountain scrub communities grow between 2,042 and 3,140 m and consist of tall shrubs that often intermix with forest stands. The predominant species in the mountain scrub communities are Wyoming big sagebrush, mountain big sagebrush, and curlleaf mountain mahogany; the understory consists of black sagebrush, serviceberry, snowberry, and bitterbrush. Aspen generally grows in riparian areas where it intergrades with Douglas-fir and Engelmann spruce at higher elevations and white fir and lodgepole pine at lower elevations. Soils in the basin are classified as Xerolls and are formed in residuum and colluvium derived from sedimentary rocks (Timothy Stack, U.S. Department of Agriculture, Natural Resources Conservation Service, written commun., 1998). Along the flood plain of Steptoe Creek, soils are fairly deep, poorly drained, and have silty to gravelly textures. The mountain slopes are covered by shallow, well-drained soils that are interspersed with outcrops of limestone and shale. These soils are alkaline, have low water-holding capacities, and range in texture from very stony over limestone bedrock to gravelly over shale bedrock.
The geology of the basin is complex and consists of highly faulted and folded marine sedimentary rocks of Paleozoic age. The areally most extensive units are the Pogonip Limestone, Chainman Shale, and Ely Limestone (Drewes, 1967). The Pogonip Limestone consists of a thick-bedded, cliff-forming limestone that primarily underlies the east side of the basin. The Chainman Shale, which underlies a broad bench along the west side of the basin, is a dark-gray shale that is highly carbonaceous, noncalcareous, and locally contains veins of selenite and carbonaceous nodules with pyrite cores. The Ely Limestone forms the
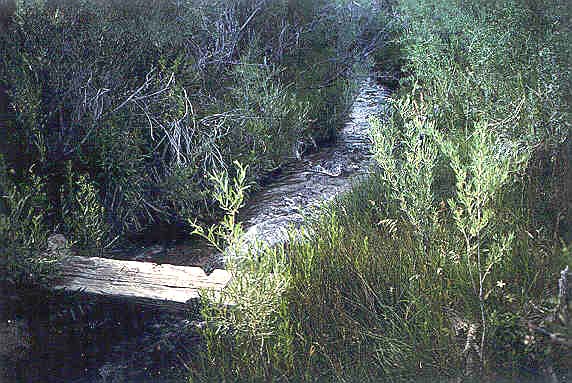 |
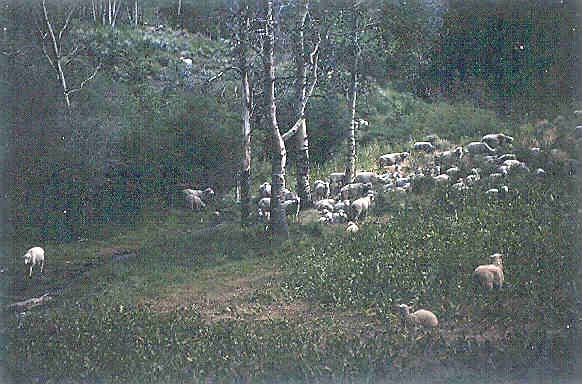
The Steptoe Creek HBN Basin drains the central part of White Pine County in Nevada and is in the Ely Ranger District of the Humboldt National Forest. About 85 percent of land in the basin is managed by the U.S. Forest Service, and the remainder, primarily along the main channel of Steptoe Creek, is privately owned. The basin can be accessed from the Steptoe Creek Road, which is a dirt road that bisects the basin from south to north. Because the road provides access to National Forest lands north of the basin, it is used heavily by tourists during the summer months. In addition to motorized travel, other land-use activities in the basin include camping, hunting, and livestock grazing. The basin is heavily used for car camping from June through October, with as many as 200 campsites on weekends and holidays. All camping is dispersed (no developed campsites), and most campsites are established on private land along the main stream channel and major tributaries (Gerald Green, U.S. Department of Agriculture, Forest Service, oral commun., 1998). Cattle and sheep grazing is permitted on National Forest land throughout the Schell Creek Range. Standards and guidelines for grazing on National Forest land, which were not enforced until 1993, are outlined in the forest-management plan (U.S. Department of Agriculture, 1986a). Two flocks of about 800 sheep each and a herd of about 20 cattle rotate in and out of the basin during the grazing season from June 15 through September 15 (Gerald Green, oral commun., 1998). Many of the springs in the basin have been developed to provide water for livestock. Plant communities in some areas have changed because of the pressures of grazing; there particularly has been a decline in scrub communities because of the invasion of Utah juniper and single-leaf pinyon pine (U.S. Department of Agriculture, 1986a). In addition to livestock, the Steptoe Creek Basin provides summer range for the Schell Creek elk herd, the largest herd in Nevada. The most substantial changes in land use in the basin during the period of record have been a decrease in grazing pressure and an increase in summer recreational use.
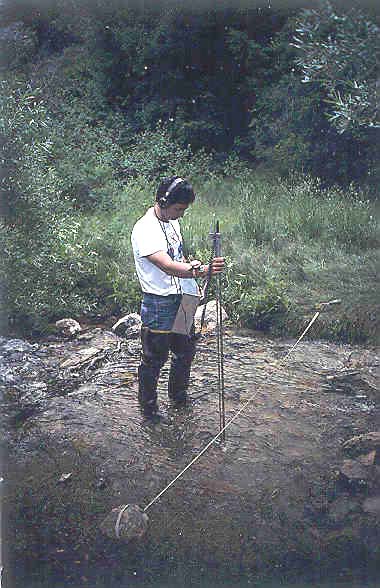
The data set for the Steptoe Creek HBN station analyzed for this report includes 192 water-quality samples that were collected from March 1968 through August 1995. Sampling frequency ranged from 8 to 12 samples per year from 1969 through 1982 (except for quarterly during 1976 and 1977) and was quarterly from 1983 to 1995. Samples from the early part
 |
Calculated ion balances for 176 samples that have complete major-ion analyses are shown in figures 17a and 17b. Graphs showing temporal variation of discharge, field pH, major-ion concentrations, and ion balance in Steptoe Creek, Nevada. Ion balances ranged from -7.7 to +22 percent, and 95 percent of the samples had values within the ±10-percent range, indicating that the analytical results are of good quality. The average ion balance for all samples was 1.2 percent, and 67 percent of samples had a slight excess of measured cations compared to measured anions in solution, indicating that unmeasured constituents, such as organic anions, may be a small component of stream water at this HBN station. Time-series plots of the major dissolved constituents were inspected for evidence of method-related effects (fig. 17). Field pH measurements increased abruptly around the beginning of 1973, which may have been caused by a change in measurement method or instrumentation used by field personnel. A similar pattern was observed at South Twin River (fig. 15), another HBN station in Nevada, providing additional evidence that the shift in pH values was an analytical artifact. Some distinct patterns also are evident in the plot of ion balance, particularly the positive values in 1978, which were followed by a period of negative values in the early 1980's. Although the cause of this pattern could not be identified, it probably indicates bias in one or more of the analytical determinations during this period of record.
[Concentrations in units of microequivalents per liter, discharge in cubic meters per second, specific conductance in microsiemens per centimeter at 25 degrees Celsius, pH in standard units, and silica in micromoles per liter; n, number of stream samples; VMW, volume-weighted mean; inst., instantaneous; spec. cond., specific conductance; <, less than; --, not reported]
| Parameter | Stream Water | Precipitation VMAa | |||||
| Minimum | First Quartile | Median | Third Quartile | Maximum | n | ||
| Discarge, inst. | 0.057 | 0.10 | 0.14 | 0.26 | 2.0 | 187 | -- |
| Spec. cond., field | 220 | 310 | 320 | 330 | 400 | 189 | 8.5 |
| pH, field | 7.6 | 8.0 | 8.4 | 8.6 | 9.0 | 179 | 5.3b |
| Calcium | 1,850 | 2,500 | 2,650 | 2,750 | 3,800 | 191 | 21 |
| Magnesium | 530 | 780 | 820 | 910 | 990 | 191 | 4.0 |
| Sodium | 44 | 74 | 78 | 91 | 180 | 191 | 7.9 |
| Potassium | 7.7 | 13 | 13 | 15 | 20 | 184 | .8 |
| Ammonium | <.7 | <.7 | 1.2 | 2.9 | 9.3 | 96 | 12 |
| Alkalinity, laboratory | 2,120 | 3,080 | 3,220 | 3,400 | 4,060 | 186 | -- |
| Sulfate | 62 | 150 | 170 | 200 | 420 | 189 | 15 |
| Chloride | 2.8 | 25 | 31 | 42 | 85 | 192 | 5.4 |
| Nitrite plus nitrate | <.7 | 8.6 | 10 | 13 | 29 | 164 | 16c |
| Silica | 73 | 110 | 120 | 120 | 170 | 190 | 8.5 |
a Values are volume-weighted mean concentrations for 1985-95.
b Laboratory pH.
c Nitrate only.
The median concentrations and ranges of major dissolved constituents in stream water collected at the HBN station and VWM concentrations in wet-only precipitation measured at the Lehman Caves NADP station are presented in table 30. Precipitation chemistry at the NADP station, which is about 45 km southeast of the HBN station, is dilute and slightly acidic
 |
The solute composition of stream water was further evaluated by analyzing correlations between solutes and stream discharge (table 31). Discharge was poorly correlated with the major solutes, except for a negative correlation with magnesium (rho = -0.648) and a positive correlation with sulfate (rho = 0.497). The lack of correlations between discharge and major solutes probably reflects the importance of springs in maintaining stream discharge during most months of the year. The positive correlation between sulfate and discharge indicates that runoff during periods of increased discharge, such as spring snowmelt, is enriched in sulfate compared to spring-fed base flow, perhaps because of compositional differences among the bedrock units. Among the solutes, the strongest correlations were between calcium and alkalinity (rho = 0.511) and sulfate and sodium (rho = 0.514), which is consistent with the weathering stoichiometry of marine limestones and shales. The cause of the weak correlations with magnesium, particularly magnesium and calcium (rho = -0.046) and magnesium and alkalinity (rho = 0.170), was unclear, particularly considering the abundance of carbonate-bearing formations in the bedrock.
[Q, discharge; Ca, calcium; Mg, magnesium; Na, sodium; K, potassium; Alk, alkalinity; SO4, sulfate; Cl, chloride; N, nitrite plus nitrate Si, silica]
|
|
|
|
|
|
|
|
|
|
|
|
| pH | -0.116 | -- | -- | -- | -- | -- | -- | -- | -- | -- |
| Ca | .326 | 0.265 | -- | -- | -- | -- | -- | -- | -- | -- |
| Mg | -.648 | .113 | -0.046 | -- | -- | -- | -- | -- | -- | -- |
| Na | .397 | -.051 | .397 | -0.039 | -- | -- | -- | -- | -- | -- |
| K | .056 | .175 | .486 | .146 | 0.380 | -- | -- | -- | -- | -- |
| Alk | .095 | .090 | .511 | .170 | .284 | 0.440 | -- | -- | -- | -- |
| SO4 | .497 | -.063 | .363 | -.103 | .514 | .361 | 0.337 | -- | -- | -- |
| Cl | .214 | .087 | .255 | .000 | .426 | .289 | .248 | 0.490 | -- | -- |
| N | .215 | -.107 | .315 | .030 | .227 | .252 | .337 | .226 | 0.170 | -- |
| Si | .363 | .046 | .497 | -.048 | .449 | .293 | .348 | .413 | .405 | 0.433 |
[Trends in units of microequivalents per liter per year, except for discharge in cubic meters per second per year, pH in standard units per year, and silica in micromoles per liter per year; <. less than; --, not calculated]
| Parameter |
Unadjusted
|
Flow adjusted
|
||
|
Trend
|
p-value
|
Trend
|
p-value
|
|
| Discharge |
-0.002
|
0.003
|
--
|
--
|
| pH, field |
.01
|
.002
|
(a)
|
--
|
| Calcium |
8.3
|
.000
|
11.5
|
0.000
|
| Magnesium |
<.1
|
.462
|
-1.4
|
.147
|
| Sodium |
-.1
|
.176
|
-.1
|
.574
|
| Potassium |
<.1
|
.134
|
<.1
|
.035
|
|
Alkalinity, laboratory
|
2.3
|
.461
|
2.6
|
.382
|
| Sulfate |
-1.5
|
.001
|
-.5
|
.291
|
| Chloride |
-.3
|
.096
|
-.2
|
.247
|
| Nitrite plus nitrate |
<.1b
|
.808
|
<.1
|
.517
|
| Silica |
<.1
|
.404
|
<.1
|
.981
|
a Flow model not significant at a = 0.10.
b Trend calculated for 1971-95.
The results of the seasonal Kendall test for trends in discharge and major dissolved constituents are listed in table 32. Statistically significant downward trends were detected in discharge and unadjusted sulfate concentrations and upward trends were detected in unadjusted pH and calcium concentrations at the 0.01 probability level. The downward trend in sulfate was not statistically significant after flow adjustment, indicating that the trend was probably caused by the trend in stream discharge. By contrast, the calcium trend was similar for the unadjusted and flow-adjusted concentrations, indicating that it was not caused by variations in stream discharge. The trend in flow-adjusted pH was not calculated because the flow model was not significant at the 0.10 probability level (Schertz and others, 1991). The LOWESS curves in figure 17 show that most of the increase in field pH occurred in the early 1970's, whereas the increase in calcium concentrations was more gradual during the period of record. The shift in pH in the early part of the record was most likely caused by a change in measurement method or instrumentation, indicating that the trend in pH is probably an analytical artifact. The cause of the upward trend in stream- water calcium could not be identified. Environmental factors that may have affected calcium concentrations include livestock grazing, recreational use, or atmospheric deposition. Changes in atmospheric deposition probably would not affect stream-water calcium at this HBN station because of the dilute chemistry of precipitation at the nearby NADP station in comparison to the chemistry of the stream. Landscape disturbance associated with grazing and camping has the potential to increase rates of base-cation leaching from soils and bedrock (Stoddard and Murdoch, 1991). Although landscape disturbance is a plausible cause of the upward trend in stream-water calcium, increases were not observed in alkalinity, as might be expected on the basis of predominance of carbonate bedrock in the basin. Laboratory bias also may have affected the concentration pattern of calcium, particularly the change in the analytical technique for major dissolved cations and trace inorganic constituents that occurred in 1983 (Office of Water Quality Technical Memorandum No. 82.18, National water-quality networks, issued September 28, 1982, at URL http://water.usgs.gov/admin/memo/).
Results of the surface-water synoptic sampling of July 23, 1991, are listed in table 33, and locations of sampling sites are shown in figure 16. During the synoptic sampling, discharge at the HBN station was 0.13 m³/s compared to the median daily discharge of 0.25 m³/s for July (Lawrence, 1987), indicating that the basin was sampled under low-flow conditions for that time of year. Most of the solute concentrations measured at the HBN station (site 1) during the synoptic sampling were generally less than the first-quartile concentrations reported for the station during the entire period of record (table 30). The tributary streams were similar in composition to stream water at site 1 with calcium and bicarbonate the predominant ions. Ion balances for all but one of the synoptic samples were positive, with an average value of +3.4 percent. The positive ion balances were somewhat unexpected because of the relatively high solute concentrations of the synoptic samples and may indicate a bias in one of the analytical measurements.
[Site locations shown in fig. 16; Q, discharge in cubic meters per second; SC, specific conductance in microsiemens per centimeter at 25 degrees Celsius; pH in standard units; Ca, calcium; Mg, magnesium; Na, sodium; K, potassium; Alk, alkalinity; SO4, sulfate; Cl, chloride; NO3, nitrate; Si, silica; concentrations in microequivalents, except silica in micromoles per liter; <, less than; --, not reported]
| Site | Station number | Q | SC | pH | Ca | Mg | Na | K | Alk | S04 | Cl | NO3 | Si | Criteriaa | Remarks |
| 1 | 10244950 |
0.13
|
310
|
8.4 |
2,550
|
770
|
65
|
12
|
3,040
|
110
|
5.6
|
7.9
|
110
|
--
|
-- |
| 2 | 391216114410400 |
.061
|
300
|
8.4 |
2,400
|
610
|
52
|
11
|
2,580
|
83
|
5.6
|
8.6
|
93
|
BG
|
Mixed lithology |
| 3 | 391231114410300 | -- | 340 | 7.9 | 2,400 | 880 | 65 | 13 | 3,120 | 120 | 5.6 |
13
|
110 |
BG
|
Mixed lithology |
| 4 | 391313114405300 | .022 | 360 | 8.3 | 2,950 | 880 | 91 | 13 | 3,520 | 210 | 20 |
4.4
|
130 |
BG, LU
|
Mixed lithology, downstream from campground |
| 5 | 391335114414400 | .0003 | 380 | 8.2 | 3,350 | 260 | 160 | 16 | 3,640 | 250 | 76 | 21 | 150 |
BG, LU
|
Ely Limestone, livestock use |
| 6 | 391416114411900 | .0003 | 390 | 8.4 | 3,800 | 250 | 110 | 10 | 3,280 | 210 | 8.5 | 12 | 170 |
BG, LU
|
Ely Limestone, livestock use |
a Criteria used in selection of sampling sites: BG = bedrock geology, LU = land use.
In general, concentrations of the major solutes did not vary markedly among the sampling sites, probably because of the presence of limestone bedrock throughout the basin. For example, calcium concentrations ranged from 2,400 to 3,800 meq/L, and alkalinity ranged from 2,580 to 3,640 meq/L (table 33). Of the weathering-derived constituents, magnesium had the widest range of concentrations, ranging from 250 to 880 meq/L, which may reflect the distribution of different rock types in the basin. For example, the lowest magnesium concentrations (sites 5 and 6) were in areas of the basin that are underlain by the Ely Limestone, whereas the highest concentrations (sites 3 and 4) were in streams draining dolomite and shale units, as well as limestone. Silica concentrations were low and uniform (93 to 170 mmol/L) across the basin, which is reasonable, based on the lack of weatherable silicate minerals in the sedimentary rocks. Chloride and nitrate concentrations were higher at site 5 compared to the other sampling sites, probably because of livestock activity near the spring. Chloride concentrations also were slightly higher at site 4 compared to the other sites, perhaps because the site is located downstream from the highest density of campgrounds in the basin.
Bailey, R.G., Avers, P.E., King, T., McNab, W.H., eds., 1994, Ecoregions and subregions of the United States with supplementary table of map unit descriptions: Washington, D.C., U.S. Department of Agriculture, Forest Service, scale 1:7,500,000.
Bauer, D.J., Foster, B.J., Joyner, J.D., and Swanson, R.A., 1996, Water resources data, Nevada, water year 1995: U.S. Geological Survey Water-Data Report NV-95-1, 734 p.
Durum, W.H., 1978, Historical profile of quality of water laboratories and activities, 1879-1973: U.S. Geological Survey Open-File Report 78-432, 235 p.
Drewes, Harald, 1967, Geology of the Connors Pass quadrangle, Schell Creek Range, east-central Nevada; stratigraphy and structure of a complexly deformed area in the Basin and Range province, and an evaluation of the tectonic environment in which it was developed: U.S. Geological Survey Professional Paper 557, 93 p.
Lawrence, C.L., 1987, Streamflow characteristics at hydrologic benchmark stations: U.S. Geological Survey Circular 941, 123 p.
Schertz, T.L., Alexander, R.B., and Ohe, D.J., 1991, The computer program Estimate Trend (ESTREND), a system for the detection of trends in water-quality data: U.S. Geological Survey Water-Resources Investigations Report 91-4040, 60 p.
Stoddard, J.L., and Murdoch, P.A., 1991, Catskill Mountains, in Charles, D.F., ed., Acidic deposition and aquatic ecosystems-Regional case studies: New York, Springer-Verlag, p. 237-272.
U.S. Department of Agriculture, 1986a, Final environmental impact statement for the Humboldt National Forest land and resource management plan: Ogden, Utah, U.S. Department of Agriculture Forest Service, Intermountain Region.
U.S. Department of the Interior, 1992, Great Basin National Park, Nevada-Final, general management plan, development concept plans, environmental impact statement: Denver, U.S. Department of the Interior, National Park Service, 434 p.
a. U.S. Geological Survey Topographic Maps:
b. Geologic Maps:
c. Soil surveys: No soil survey available
d. Miscellaneous Maps:
Table B-1. NWIS site-identification numbers and site names for water-quality sampling sites.
|
|
|
|
| 1 | 10244950 | STEPTOE CR NR ELY, NV |
| 2 | 391216114410400 | CLEAR SPRING CR NR ELY, NV |
| 3 | 391231114410300 | SECOND EAST TRIB TO STEPTOE CR NR ELY, NV |
| 4 | 391313114405300 | STEPTOE CR AT CAMPSITE NR ELY, NV |
| 5 | 391335114414400 | ASPEN SPRING CR NR ELY, NV |
| 6 | 391416114411900 | UPPER STEPTOE CR NR ELY, NV |
| Back to 1173-D Contents |
This page maintained by Nichole Bisceglia.
Last updated August 3, 2000.