
Hydrologic Benchmark Network Stations in the Western U.S. 1963-95 (USGS Circular 1173-D)
To download a printer friendly PDF version of this information click here.
This report details one of the approximately 50 stations in the Hydrologic Benchmark Network (HBN) described in the four-volume U.S. Geological Survey Circular 1173. The suggested citation for the information on this page is:
|
Mast, M.A., and Clow, David W., 2000, Environmental characteristics and water-quality of Hydrologic Benchmark Network stations in the Western United States, U.S. Geological Survey Circular 1173-D, 115 p. |
All of the tables and figures are numbered as they appear in each circular. Use the navigation bar above to view the abstract, introduction and methods for the entire circular, as well as a map and list of all of the HBN sites. Use the table of contents below to view the information on this particular station.
|
Table of Contents |
| 1. Site Characteristics and Land Use |
| 2. Historical Water Quality Data and Time-Series Trends |
| 3. Synoptic Water Quality Data |
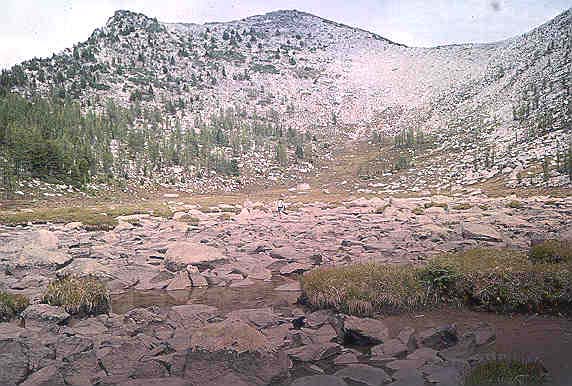
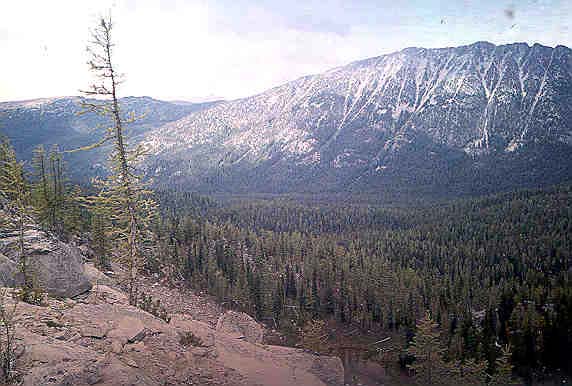
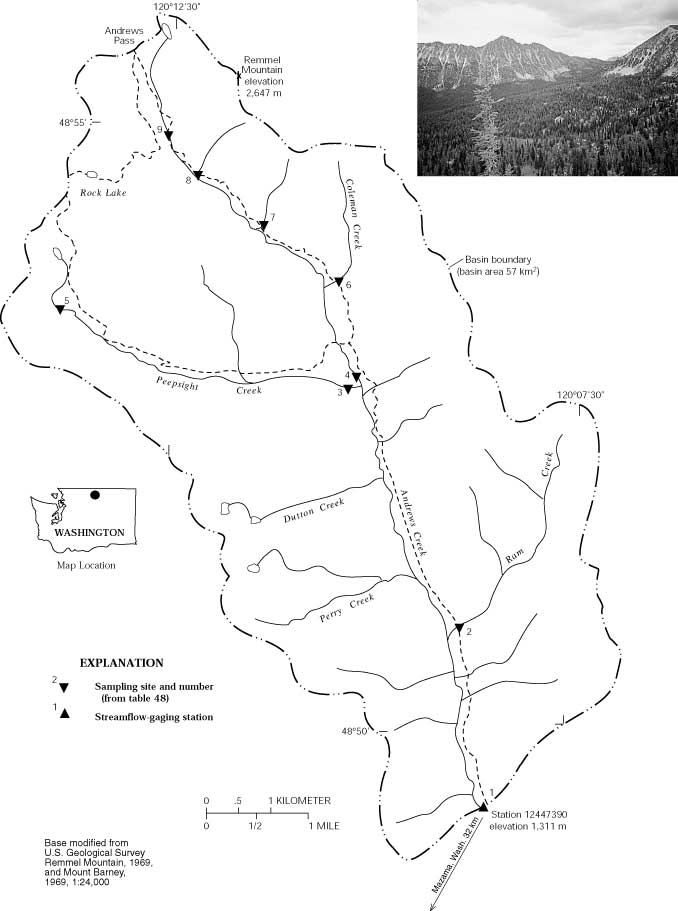
The Andrews Creek HBN Basin is located in the Northern Rocky Mountains physiographic province in the Cascade Mountains in northern Washington (Figure 24. Map showing the study area in the Andrews Creek Basin and photograph showing the basin landscape). The 57-km² basin drains a V-shaped valley and rugged mountainous terrain that ranges in elevation from 1,311 m at the HBN station to 2,647 m at the summit of Remmel Mountain. The HBN station is located 32 km northeast of Mazama, Wash., at latitude 48°49'23'' and longitude 120°'08'41''. Andrews Creek flows southeast into the
 |
The basin is in the subalpine forest zone of the Cascade ecoregion (Bailey and others, 1994). Most forests in the basin are dominated by subalpine fir and Engelmann spruce and have variable amounts of lodgepole pine, ponderosa pine, Douglas-fir, and Pacific silver fir. Common understory species are beargrass, huckleberry, and serviceberry, and a ground cover of pinegrass, whortleberry, and lupine. Closer to timberline, forest communities are dominated by whitebark pine on southerly aspects and subalpine larch on northerly aspects; the understory consists of heathers, dwarf willows, and sedges. Timberline extends to about 2,200 m, above which vegetation is mostly lichens, forbs, and alpine shrubs. Soils in the basin are predominantly Cryoborolls and Cryochrepts that formed in glacial deposits and residuum from the granitic bedrock (Okanogan National Forest, written commun., 1998). In general, the soils are moderately deep (70 to 130 cm), are slightly acidic (pH 5.6 to 6.4), and consist of as much as 50 percent rock fragments. A typical profile has a surface layer of dark-brown silt loam usually 25 to 30 cm thick overlying a subsoil of yellowish-brown, fine sandy loam to gravelly loamy sand.
Bedrock underlying the basin is intrusive igneous rocks of Cretaceous age (Staatz, 1971). The predominant rock types are quartz monzonite and quartz diorite, which are generally light gray or light pinkish gray, medium to coarse grained, and locally porphyritic. The principal minerals are plagioclase, quartz, and perthite, and the accessory minerals are biotite, muscovite, garnet, apatite, magnetite, and chlorite. Several types of dikes that are andesitic, basaltic, and pegmatitic in composition are widely scattered in the quartz monzonite. Mineral deposits are widespread throughout the Pasayten Wilderness Area;
 |
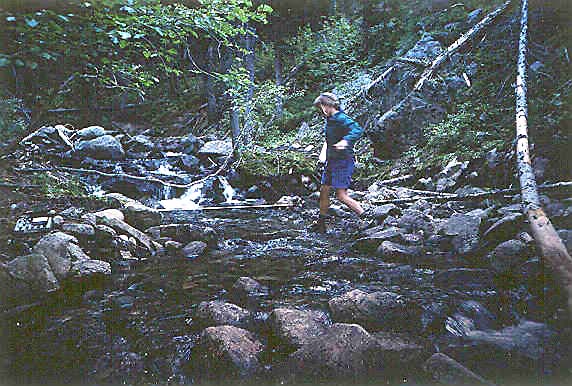
The basin drains the northwestern part of Okanogan County in Washington and is entirely in the boundaries of the Pasayten Wilderness Area, which is administered by the Methow Ranger District of the Okanogan National Forest. No motorized vehicles are allowed in the wilderness, and the HBN station can be reached by a 5.6-km pack trail that starts near the mouth of Andrews Creek. Access upstream from the station is limited to a pack trail that parallels the main channel of Andrews Creek up to Andrews Pass along the northern basin divide. The trail generally is free of snow from July through October, and winter access is limited to skis and snowshoes. Land use in the basin is limited to dispersed recreational activities and some livestock grazing (Okanogan National Forest, written commun., 1998). The trail along Andrews Creek is heavily used by hikers, horseback riders, pack animals, and livestock from July through September because it is one of the main access trails into the interior of the Pasayten Wilderness. Cattle grazing has been allowed in the basin since the establishment of the wilderness in 1968, although prior to this time, the area was heavily grazed by sheep. In even years, about 320 cattle are permitted to graze in the northeastern part of the basin from mid-July to mid-September (Okanogan National Forest, written commun., 1998). In odd years, cattle are allowed to pass through the basin enroute to grazing allotments in other parts of the wilderness. No grazing occurred in the basin from 1995 through 1997.
The data set for the Andrews Creek HBN station that was analyzed for this report includes 165 water-quality samples that were collected from December 1971 through August 1995. Samples were collected monthly from 1974 to 1982 and quarterly from 1983 to 1995. Water-quality samples collected prior to 1973 probably were analyzed at a USGS district laboratory in Portland, Oreg. (Durum, 1978). After establishment of the central laboratory system, samples were analyzed at the Salt Lake City, Utah, laboratory from 1973 to 1975 and at the NWQL in Arvada, Colo., from 1976 to 1995. Daily discharge records for Andrews Creek (station 12447390) are available beginning in June 1968.
The North Fork Quinault River (12039300) was another HBN station in Washington that operated until 1986 when the gaging
 |
Calculated ion balances for 156 samples that have complete major-ion analyses are shown in figures 25a and 25b. Graphs showing temporal variation of discharge, field pH, major-ion concentrations, and ion balance in Andrews Creek, Washington. Ion balances ranged from -22 to 16 percent, and 85 percent of samples had values in the ±10-percent range, indicating that the analytical measurements were of good quality. The average charge balance for all samples was -3.7 percent, and almost 75 percent of samples had a slight excess of measured cations compared to measured anions, indicating that unmeasured constituents, such as organic anions, are an important component of stream water at this HBN station. Time-series plots of the major constituents were inspected for evidence of method-related effects (fig. 25). Some notable patterns are evident in field pH values and in sulfate and chloride concentrations. The scatter in field pH values decreased distinctly beginning in 1984, probably because of improvements in field pH meters and electrodes (Office of Water Quality Technical Memorandum No. 81.08, Electrodes for pH measurement in low-conductivity waters, issued February 10, 1981, at URL http://water.usgs.gov/admin/memo/, accessed 1998). Sulfate concentrations were low and had considerably less data scatter at the end of the record, perhaps because of the change in analytical technique to ion chromatography in 1990. Prior to 1990, a number of different analytical techniques were used for sulfate, including titrimetry before 1976, colorimetry from 1976 to 1982, and turbidimetric titration from 1983 to 1989 (Fishman and others, 1994). Assuming that sulfate concentrations determined by ion chromatography were historically the most accurate, the temporal pattern in sulfate indicates that most of the earlier analytical techniques probably caused a positive bias in the measured sulfate concentrations. The high chloride concentrations evident in the early part of the record are coincident with the period when samples were analyzed at the Salt Lake City, Utah, laboratory, indicating the possibility of analytical bias.
[Concentrations in units of microequivalents per liter, discharge in cubic meters per second, specific conductance in microsiemens per centimeter at 25 degrees Celsius, pH in standard units, and silica in micromoles per liter; n, number of stream samples; VMW, volume-weighted mean; inst., instantaneous; spec. cond., specific conductance; <, less than; --, not reported]
| Parameter | Stream Water | Precipitation VMAa | |||||
| Minimum | First Quartile | Median | Third Quartile | Maximum | n | ||
| Discarge, inst. | 0.057 | 0.12 | 0.22 | 0.93 | 16 | 165 | -- |
| Spec. cond., field | 18 | 38 | 51 | 58 | 79 | 164 | 5.6 |
| pH, field | 6.4 | 7.4 | 7.6 | 7.7 | 8.8 | 162 | 5.1b |
| Calcium | 90 | 250 | 340 | 380 | 460 | 165 | 1.5 |
| Magnesium | 16 | 58 | 82 | 91 | 200 | 165 | 1.9 |
| Sodium | 35 | 78 | 96 | 110 | 320 | 162 | 6.0 |
| Potassium | 2.6 | 10 | 13 | 15 | 38 | 161 | .3 |
| Ammonium | <.7 | <.7 | 1.4 | 4.3 | 13 | 75 | 1.8 |
| Alkalinity, laboratory | 160 | 360 | 520 | 580 | 700 | 164 | -- |
| Sulfate | <2.1 | 23 | 38 | 60 | 150 | 164 | 7.1 |
| Chloride | <2.8 | 5.6 | 8.5 | 17 | 68 | 165 | 7.0 |
| Nitrite plus nitrate | .7 | 2.9 | 5.0 | 7.1 | 15 | 156 | 4.8c |
| Silica | 110 | 150 | 170 | 180 | 220 | 165 | -- |
a Values are volume-weighted mean concentrations for 1984-95.
b Laboratory pH.
c Nitrate only.
The median concentrations and ranges of major dissolved constituents in stream water collected at the HBN station and VWM concentrations in wet-only precipitation measured at the Cascades National Park NADP station are presented in table 45. Precipitation chemistry at the NADP station, which is about 100 km southwest of the HBN station, is very dilute and slightly acidic and had a VWM pH of 5.1 for 12 years of record. The predominant cations in precipitation were hydrogen and sodium, which contributed 42 and 30 percent of the total cation charge, respectively. The predominant anions were sulfate and chloride, which each accounted for 37 percent of the total anions. These results indicate that precipitation is a dilute mixture of acids derived from industrial emissions of sulfur and from salt derived from marine aerosols.
Stream water in Andrews Creek is dilute and weakly buffered; specific conductance ranged from 18 to 79 mS/cm, and alkalinity ranged from 160 to 700 meq/L (table 45). The major cation in stream water was calcium, and the major anion was bicarbonate. The predominance of calcium compared to sodium in stream water is inconsistent with simple stoichiometric
 |
The solute composition of stream water was further evaluated by analyzing correlations between solutes and stream discharge (table 46). The weathering-derived solutes had strong inverse correlations with stream discharge, particularly calcium (rho = -0.905) and silica (rho = -0.842). These results are consistent with a hydrologic system where weathering-enriched base flow is diluted by waters from shallow or surficial sources during periods of increased discharge, particularly spring snowmelt. For the solutes, the strongest correlations were found among the base cations, alkalinity, and silica, which is consistent with the weathering stoichiometry of silicate minerals in the granitic bedrock. The weak correlations between chloride and sulfate provide additional evidence for the assumption that these solutes are primarily derived from atmospheric sources.
[Q, discharge; Ca, calcium; Mg, magnesium; Na, sodium; K, potassium; Alk, alkalinity; SO4, sulfate; Cl, chloride; Si, silica]
|
|
|
|
|
|
|
|
|
|
|
| pH | 0.050 | -- | -- | -- | -- | -- | -- | -- | -- |
| Ca | -.905 | -0.024 | -- | -- | -- | -- | -- | -- | -- |
| Mg | -.772 | -.008 | 0.841 | -- | -- | -- | -- | -- | -- |
| Na | -.823 | .096 | .812 | 0.718 | -- | -- | -- | -- | -- |
| K | -.568 | .010 | .633 | .853 | 0.598 | -- | -- | -- | -- |
| Alk | -.829 | .003 | .856 | .744 | .811 | 0.587 | -- | -- | -- |
| SO4 | .072 | -.040 | -.058 | -.015 | -.072 | .139 | -0.108 | -- | -- |
| Cl | -.080 | .066 | .035 | .017 | .076 | -.005 | .036 | 0.252 | -- |
| Si | -.842 | -.021 | .811 | .716 | .761 | .596 | .736 | .044 | 0.037 |
[Trends in units of microequivalents per liter per year, except for discharge in cubic meters per second per year, pH in standard units per year, and silica in micromoles per liter per year; <, less than; --, not calculated]
| Parameter |
Unadjusted
|
Flow adjusted
|
||
|
Trend
|
p-value
|
Trend
|
p-value
|
|
| Discharge |
-0.001
|
0.607
|
--
|
--
|
| pH, field |
<.01
|
.056
|
<0.01
|
0.070
|
| Calcium |
3.0
|
.002
|
2.4
|
.000
|
| Magnesium |
0.6
|
.005
|
0.5
|
.000
|
| Sodium |
<.1
|
.395
|
<.1
|
.414
|
| Potassium |
<.1
|
.703
|
<.1
|
.849
|
|
Alkalinity, laboratory
|
3.5
|
.009
|
3.8
|
.000
|
| Sulfate |
-1.3
|
.000
|
(a)
|
--
|
| Chloride |
-.3
|
.008
|
(a)
|
--
|
| Nitrite plus nitrate |
(b)
|
--
|
--
|
--
|
| Silica |
<.1
|
.460
|
<.1
|
.702
|
a Flow model not significant at a = 0.10.
b Insufficient data to calculate trend.
The results of the seasonal Kendall test for trends in discharge and major dissolved constituents are listed in table 47. Statistically significant trends were detected in unadjusted calcium, magnesium, alkalinity, sulfate, and chloride concentrations at the 0.01 probability level. Trends were not calculated for the flow-adjusted sulfate and chloride concentrations because the flow models were not statistically significant at the 0.10 probability level. Trends were similar for the unadjusted and flow-adjusted calcium, magnesium, and alkalinity concentrations, indicating that they probably were not caused by variations in stream discharge. The LOWESS curves in figure 25 showed somewhat different temporal patterns for sulfate and chloride. Most of the decrease in chloride concentrations result from a period of high concentrations near the beginning of the period of record, whereas the decline in sulfate was driven by lower than average concentrations near the end of the record. The LOWESS curves for the unadjusted calcium, magnesium, and alkalinity concentrations are difficult to interpret because of strong seasonal variations in the concentrations of these solutes. Although not shown in figure 25, LOWESS curves for the flow-adjusted concentrations showed that most of the increase in calcium and magnesium concentrations occurred prior to 1982, whereas most of the increase in alkalinity occurred after 1982. Possible causes of stream-water trends at this HBN station include environmental factors, such as changes in land use or atmospheric deposition, and method-related factors, particularly changes in analytical techniques. Changes in land-use probably did not affect stream-water chemistry because the basin is entirely within a wilderness area, and there have been few changes in land use other than a slight decrease in grazing and increase in recreational use. Changes in atmospheric deposition are difficult to confirm because no long-term records of precipitation chemistry are available for this station. However, a recent study reported statistically significant downward trends in sulfate, chloride, calcium, and magnesium at several NADP stations in the northwestern United States from 1980 to 1992 (Lynch and others, 1995). Although the trends in precipitation chemistry seem to be consistent with the trend in stream-water sulfate, they do not account for increases in stream-water calcium and magnesium or the decline in chloride prior to 1980 (fig. 25). Stream-water trends at this station are more likely to be artifacts of analytical bias rather than environmental change. For example, the decrease in chloride concentrations was concurrent with a change in analytical laboratory, whereas the decline in sulfate concentrations, particularly after 1990, seems to be caused by several changes in analytical techniques. The timing of the calcium and magnesium trends also indicates that they may have been affected by a change in analytical technique for major dissolved cations and trace inorganic constituents that occurred in 1983 (Office of Water Quality Technical Memorandum No. 82.18, National water-quality networks, issued September 28, 1982, at URL http://water.usgs.gov/admin/memo/, accessed 1998).
Chemical results of the surface-water synoptic sampling of September 1-2, 1993, are listed in table 48, and locations of sampling sites are shown in figure 24. During the synoptic sampling, discharge at the HBN station was 0.40 m³/s compared to the median daily discharge of 0.31 m³/s for August and 0.20 m³/s for September (Lawrence, 1987), indicating that the basin was sampled under slightly higher than normal flow conditions for that time of year. Most of the solute concentrations measured at the HBN station (site 1) during the synoptic sampling were between the first-quartile and median values that were reported for the station during the entire period of record, except for sulfate and chloride concentrations, which were lower (table 45). The major solutes in the tributary streams were calcium and bicarbonate, and the concentrations bracketed the concentrations measured at site 1. Ion balances for all the synoptic samples were positive (ranging from 0.2 to 5.5 percent), indicating that unmeasured ions, such as organic anions, may have contributed to the ionic content of stream water during the synoptic sampling.
[Site locations shown in fig. 24; Q, discharge in cubic meters per second; SC, specific conductance in microsiemens per centimeter at 25 degrees Celsius; pH in standard units; Ca, calcium; Mg, magnesium; Na, sodium; K, potassium: Alk, alkalinity; SO4, sulfate; Cl, chloride; NO3, nitrate; Si, silica; concentrations in microequivalents per liter, except silica in micromoles per liter; <, less than; --, not reported]
| Site | Station number | Q | SC | pH | Ca | Mg | Na | K | Alk | S04 | Cl | NO3 | Si | Criteriaa | Remarks |
| 1 | 12447390 |
0.40
|
47
|
7.7 |
310
|
74
|
87
|
12
|
450
|
16
|
3.4
|
<3.6
|
150
|
--
|
|
| 2 | 485052120085800 |
.0045
|
30
|
7.6 |
170
|
46
|
78
|
12
|
280
|
10
|
2.8
|
<3.6
|
180
|
T
|
Perrenial tributary |
| 3 | 485244120101000 | .057 | 29 | 7.4 | 180 | 37 | 74 | 5.1 | 250 | 9.0 | 2.3 |
<3.6
|
160 |
T
|
Perrenial tributary |
| 4 | 485245120100700 | -- | 39 | 7.5 | 250 | 50 | 70 | 10 | 340 | 19 | 2.8 |
<3.6
|
150 |
MC
|
Andrews Creek upstream from Peepsight Creek |
| 5 | 485354120134900 | -- | 6.3 | 7.3 | 25 | 1.6 | 30 | 1.5 | 50 | 5.4 | 1.1 | <3.6 | 120 |
T
|
Downstream from small cirque pond |
| 6 | 485353120103700 | -- | 66 | 7.5 | 480 | 100 | 74 | 23 | 640 | 25 | 4.2 |
<3.6
|
160 | LU | Downstream from grazing area |
| 7 | 485412120113600 | -- | 19 | 7.5 | 130 | 18 | 52 | 2.8 | 170 | 6.9 | 2.8 |
<3.6
|
120 | T | Intermittent tributary |
| 8 | 485435120121100 | -- | 33 | 7.5 | 210 | 26 | 65 | 11 | 230 | 67 | 2.3 |
<3.6
|
150 | T | Intermittent tributary |
| 9 | 485455120123300 | .011 | 29 | 7.6 | 200 | 38 | 57 | 4.6 | 260 | 14 | 2.5 | <3.6 | 120 | MC | Andrews Creek near headwaters |
a Criteria used in selection of sampling sites: MC = main channel, LU = land use, T = tributary.
In general, stream chemistry was dilute and did not vary markedly among the sampling sites, which primarily reflects the uniform composition and slow-weathering rate of minerals in the granitic bedrock. Except for site 5, specific conductance ranged from 19 to 66 mS/cm, calcium ranged from 130 to 480 meq/ L, and alkalinity ranged from 170 to 640 meq/L (table 48). Stream water collected a site 5 was considerably more dilute than stream water at the other synoptic sampling sites because it was collected just downstream from a small cirque pond that primarily is fed by direct snowmelt and rainfall. The weathering-derived solutes, particularly calcium, magnesium, and alkalinity, were strongly correlated with chloride concentrations (0.70 r 0.94). Assuming stream-water chloride is primarily derived from atmospheric deposition, these results indicate that most of the intrabasin variability in concentrations can be accounted for by evapotranspiration. One notable exception was silica, which not only had a weaker correlation with chloride (r=0.52) but had a high concentration at site 5 compared to the other solute concentrations. Sulfate concentrations ranged from 5.4 to 67 meq/L and, except for site 8, also were correlated with chloride (r = 0.80), indicating that most of the variability was related to differences in deposition or evapotranspiration. Assuming that sulfate deposition rates were not substantially different among the sampling sites, the most plausible explanation for the high sulfate concentration at site 8 is weathering of an unmapped mineralized zone upstream from the sampling site. Chloride and nitrate concentrations were uniformly low in the basin; chloride ranged from 1.1 to 4.2 meq/L, and nitrate concentrations were less than the analytical reporting limit of 3.6 meq/L. These results are consistent with the low concentrations of chloride and nitrate in precipitation and also provide no evidence that human-related activities affected stream-water concentrations of these solutes during the sampling period.
Bailey, R.G., Avers, P.E., King, T., McNab, W.H., eds., 1994, Ecoregions and subregions of the United States with supplementary table of map unit descriptions: Washington, D.C., U.S. Department of Agriculture, Forest Service, scale 1:7,500,000.
Clow, D.W., Mast, M.A., and Campbell, D.H., 1996, Controls on surface water chemistry in the upper Merced River Basin, Yosemite National Park, California: Hydrological Processes, v. 10, p. 727-746.
Durum, W.H., 1978, Historical profile of quality of water laboratories and activities, 1879-1973: U.S. Geological Survey Open-File Report 78-432, 235 p.
Fishman, M.J., Raese, J.W., Gerlitz, C.N., and Husband, R.A., 1994, U.S. Geological Survey approved inorganic and organic methods for the analysis of water and fluvial sediment, 1954-94: U.S. Geological Survey Open-File Report 94-351, 55 p.
Lawrence, C.L., 1987, Streamflow characteristics at hydrologic benchmark stations: U.S. Geological Survey Circular 941, 123 p.
Lynch, J.A., Grimm, J.W., and Bowersox, V.C., 1995, Trends in precipitation chemistry in the United States-A national perspective, 1980-1992: Atmospheric Environment, v. 29, no. 11, p. 1231-1246.
Nelson, P.O., 1991, Cascade Mountains, in Charles, D.F., ed., Acidic deposition and aquatic ecosystems-Regional case studies: New York, Springer-Verlag,p. 531-566.
Staatz, M.H., 1971, Mineral resources of the Pasayten Wilderness Area, Washington: U.S. Geological Survey Bulletin 1325, 255 p.
Turk, J.T., and Spahr, N.E., 1991, Rocky Mountains, in Charles, D.F., ed., Acidic deposition and aquatic ecosystems-Regional case studies: New York, Springer-Verlag, p. 48-92.
U.S. Department of Agriculture, 1989, Final environmental impact statement, land and resource management plan, Okanogan National Forest: Portland, Oreg., U.S. Department of Agriculture Forest Service, Pacific Northwest Region.
Wiggins, W.D., Ruppert, G.P., Smith, R.R., Read, L.L., Hubbard, L.E., and Courts, M.L., 1996, Water resources data, Washington, water year 1995: U.S. Geological Survey Water-Data Report WA-95-1, 456 p.
a. U.S. Geological Survey Topographic Maps:
b. Geologic Maps:
c. Soil survey: No soil survey available.
d. Miscellaneous Map:
Table B-1. NWIS site-identification numbers and site names for water-quality sampling sites.
|
|
|
|
| 1 | 12447390 | ANDREWS CR NR MAZAMA, WA |
| 2 | 485052120085800 | RAM CR NR MAZAMA, WA |
| 3 | 485244120101000 | PEEPSIGHT CR NR MAZAMA, WA |
| 4 | 185245120100700 | ANDREWS CR AB PEEPSIGHT NR MAZAMA, WA |
| 5 | 485354120134900 | PEEPSIGHT CR BLW DRY LAKE NR MAZAMA, WA |
| 6 | 485353120103700 | COLEMAN TRIB NR MAZAMA, WA |
| 7 | 485412120113600 | SWAMP GAS TRIB NR MAZAMA, WA |
| 8 | 485435120121100 | REMMEL MTN TRIB NR MAZAMA, WA |
| 9 | 485455120123300 | UPPER ANDREWS CR NR MAZAMA, WA |
| Back to 1173-D Contents |
This page maintained by Nichole Bisceglia.
Last updated August 4, 2000.