Previous Section: Box A
Next Section: Box B
Return to Table of Contents
Return to Home Page
All water-level monitoring programs depend on the operation of a network of observation wells—wells selected expressly for the collection of water-level data in one or more specified aquifers. Decisions made about the number and locations of observation wells are crucial to any water-level data collection program. Ideally, the wells chosen for an observation well network will provide data representative of various topographic, geologic, climatic, and land-use environments. Decisions about the areal distribution and depth of completion of observation wells also should consider the physical boundaries and geologic complexity of aquifers under study. Water-level monitoring programs for complex, multilayer aquifer systems may require measurements in wells completed at multiple depths in different geologic units. Large, regional aquifers that extend beyond State boundaries require a network of observation wells distributed among one or more States. If one of the purposes of a network is to monitor ambient ground-water conditions, or the effects of natural, climatic-induced hydrologic stresses, the observation network will require wells that are unaffected by pumping, irrigation, and land uses that affect ground-water recharge. These and many other technical considerations pertinent to the design of a water-level observation network are discussed in more detail in technical papers by Peters (1972), Winter (1972), and Heath (1976).
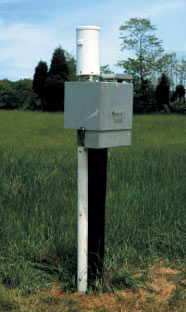
Commonly overlooked is the need to collect other types of hydrologic information as part of a water-level monitoring program. Meteorological data, such as precipitation data, aid in the interpretation of water-level changes in observation wells. Where observation wells are located in alluvial aquifers or other aquifers that have a strong hydraulic connection to a stream or lake, hydrologic data, such as stream discharge or stage, are useful in examining the interaction between ground water and surface water. Meteorological and streamflow data commonly are available from other sources; but if not, some monitoring of variables such as streamflow and precipitation may be needed to supplement the water-level data, particularly in remote areas or in small watersheds. In addition, water-use data, such as pumping rates and volumes of pumped water, can greatly enhance the interpretation of trends observed in water levels and explain changes in the storage and availability of ground water that result from water withdrawals over time.
|
|
Well with tipping-bucket rain gage mounted on top |
The frequency of water-level measurements is among the most important components of a water-level monitoring program. Although often influenced by economic considerations, the frequency of measurements should be determined to the extent possible with regard to the anticipated variability of water-level fluctuations in the observation wells and the data resolution or amount of detail needed to fully characterize the hydrologic behavior of the aquifer. These aspects are discussed more fully in Box B.
Typically, collection of water-level data over one or more decades is required to compile a hydrologic record that encompasses the potential range of water-level fluctuations in an observation well and to track trends with time. Systematic, long-term collection of water-level data offers the greatest likelihood that water-level fluctuations caused by variations in climatic conditions and water-level trends caused by changes in land-use or water-management practices will be “sampled.” The availability of long-term water-level records greatly enhances the ability to forecast future water levels. Therefore, observation wells should be selected with an emphasis on wells for which measurements can be made for an indefinite time.
Typically, collection of water-level data over one or more decades is required to compile a hydrologic record that encompasses the potential range of water-level fluctuations in an observation well and to track trends with time.
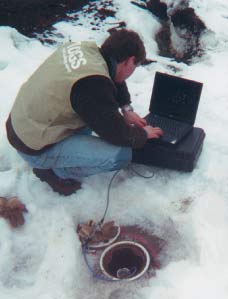 |
Downloading water-level data from an observation well in Oregon instrumented with a down-hole transducer/logger. Photograph by David S. Morgan, U.S. Geological Survey. |
Good quality-assurance practices help to maintain the accuracy and precision of water-level measurements, ensure that observation wells reflect conditions in the aquifer being monitored, and provide data that can be relied upon for many intended uses. Therefore, field and office practices that will provide the needed levels of quality assurance for water-level data should be carefully thought out and consistently employed.
Some important field practices that will ensure the quality of ground-water-level data include the establishment of permanent datums (reference points for water-level measurements) for observation wells, periodic inspection of the well structure, and periodic hydraulic testing of the well to ensure its communication with the aquifer. The locations and the altitudes of all observation wells should be accurately surveyed to establish horizontal and vertical datums for long-term data collection. Inaccurate datums are a major source of error for water-level measurements used as control points for contoured water-level or potentiometric-surface maps and in the calibration and sensitivity analysis of numerical ground-water models. Recent advances in the portability and operation of traditional surveying equipment, and in Global Positioning System (GPS) technology, have simplified the process of obtaining a fast, accurate survey of well location coordinates and datums.
Existing wells selected and used for long-term water-level monitoring should be carefully examined to ensure that no construction defects are present that might affect the accuracy of water-level measurements. This may entail the use of a downhole video camera to inspect the well screen and casing construction. Over time, silting, corrosion, or bacterial growth may adversely affect the way the well responds to changes in the aquifer. Any well selected for inclusion in an observation network should be hydraulically tested to ensure it is in good communication with the aquifer of interest. Hydraulic tests should be repeated periodically to ensure that hydraulic communication between the well and the aquifer remains optimal and that the hydraulic response of the well reflects water-level (head) fluctuations in the aquifer as accurately as possible.
To help maintain quality assurance, a permanent file that contains a physical description of well construction, location coordinates, the datum used for water-level measurements, and results of hydraulic tests should be established for each observation well. Recent water-level measurements should be compared with previous measurements made under similar hydrologic conditions to identify potential anomalies in water-level fluctuations that may indicate a malfunction of measuring equipment or a defect in observation-well construction.
Hydraulic tests should be repeated periodically to ensure that the hydraulic response of the well reflects water-level (head) fluctuations in the aquifer as accurately as possible.
Water-level data reporting techniques vary greatly depending on the intended use of the data, but too often water-level measurements are simply tabulated and recorded in a paper file or electronic database. Simple tabulation is useful for the determination of average, maximum, and minimum water levels but does not easily reveal changes or trends caused by seasonal and annual differences in precipitation, water use, or other hydrologic stresses.
Water-level hydrographs—graphical plots showing changes in water levels over time—are a particularly useful form of data reporting. Such hydrographs provide a visual depiction of the range in water-level fluctuations, seasonal water-level variations, and the cumulative effects of short-term and long-term hydrologic stresses. In general, the value and reliability of the information presented by a water-level hydrograph improves with increasing frequency of measurement and period of record. Hydrographs that are constructed from infrequent water-level measurements, or that have significant gaps in time between the measurements, generally are difficult to interpret and may lead to biased or mistaken interpretations about the frequency and magnitude of water-level fluctuations and their causes. Depending on the frequency of water-level measurement and period of hydrologic record, water-level hydrographs can be constructed to illustrate historical water levels, compare recent and historical water-level data, and present descriptive statistics for water-level measurements (Figure 1).
The accessibility of water-level data is greatly enhanced by the use of electronic databases, especially those that incorporate Geographic Information System (GIS) technology to visually depict the locations of observation wells relative to pertinent geographic, geologic, or hydrologic features. The availability of electronic information transfer on the Internet greatly enhances the capability for rapid retrieval and transmittal of water-level data to potential users. Water-level hydrographs, maps of observation-well networks, tabulated water-level measurements, and other pertinent information all can be configured for access on the Internet. A significant advantage of this method of data reporting is the ease and speed with which ground-water-level data can be updated and made available to users.
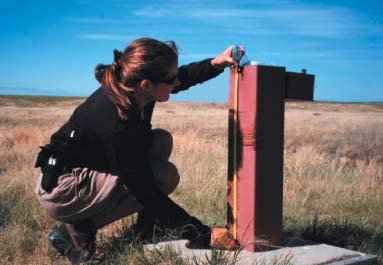 |
Measuring well “stickup” to establish water-level measurement datum. Photograph by Heather Handran, U.S. Geological Survey. |
 |
| Figure 1. Hydrographs for a well in Vanderburgh County, Indiana, showing (A) continuous record of daily water-level measurements made over about a decade, (B) comparison between water-level measurements made in a single year to historical high and low water-level measurements, and (C) statistical distribution (boxplots) of water levels for each month. |
[an error occurred while processing this directive]