Existing water-use estimation efforts need improved coordination and analysis of program effectiveness to reflect the increased importance of, and demands for, national water-use data and analyses. The USGS has compiled and disseminated estimates of water use for the Nation at 5-year intervals since 1950 (Solley and others, 1998). Water-use information is compiled in collaboration with the States through the USGS Cooperative Water Program. Differences among the States in the types of water uses, in funding priorities, and in regulations that require reporting of water-use information have resulted in an unevenness in the breadth and depth of water-use data collected for each State.
A goal of this element of an assessment is to strengthen and enhance future studies of the Nation’s water use along the lines recommended by the National Research Council (NRC) in a recent review of the USGS water-use program (Box C). A key recommendation of the NRC review was to use sampling strategies and mathematical (regression) modeling to develop statistically derived water-use estimates. This statistical approach, which could be undertaken as part of the assessment, would identify demographic, economic, geologic, hydrologic, and climatic indicators that are correlated with water use and that can be used to supplement existing water-use data. Statistical correlations developed between water use and these related indicators might allow improved understanding of past trends in water use and better prediction of future changes in water demands and water uses. Estimates of irrigation water use, for example, are well suited to statistical applications because irrigation withdrawals are closely related to indicators such as climate, farming and irrigation techniques, and irrigated acreage (fig. 7). Reshaping the national water-use data-collection strategies by using statistical techniques also would help to develop consistent methods for estimating water use across State and regional boundaries.
|
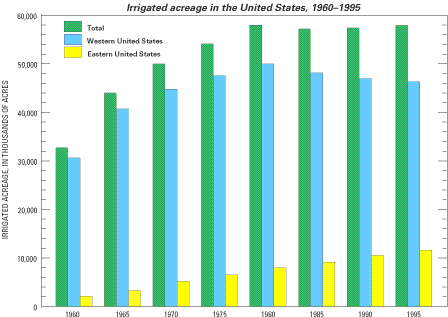
| Figure 7. Nationally, withdrawals for irrigation are a large percentage of total water use, accounting for 40 percent of total withdrawals and 80 percent of consumptive uses in 1995 (Solley, 1998). Total irrigation withdrawals and irrigated acreage in the United States steadily increased between 1960 and 1980, but then declined in 1985 and has remained fairly steady since. The decrease in irrigated acreage in the West is a result of expanding urban areas and an increase in dryland farming. In contrast, irrigated acreage in the East increased steadily over the same 35-year period, especially in areas with favorable climate, topography, and available water. (Data compiled from U.S. Geological Survey Circulars titled “Estimated use of water in the United States” published in 5-year intervals between 1960 and 1995.) |
Under such an assessment, water-use estimates would be provided at 5-year intervals by county, State, and major water-resources regions of the Nation. As statistical techniques are developed, the assessment would move toward annual accounting of high-priority water-use sectors such as public supply and irrigation. In addition, efforts would be made to develop water-use estimates for each of the 352 hydrologic accounting units and for the Nation’s major aquifer systems. As in previous water-use assessments, State agencies would be a major partner in the collection and reporting of water-use indicators.
An enhanced national water-use database would be developed and maintained to provide ready access to water-withdrawal, conveyance, and return-flow information. The database also would store ancillary data sets on the related water-use indicators. Some of the data sets for these related indicators are available from State agencies and other Federal agencies, such as the Department of Agriculture, Department of Energy, Bureau of Economic Analysis, and Bureau of the Census. Consistent and accessible water-use data made available through a national water-use database would be the foundation for integrating water- use data with water-flow and water-quality data to generate policy-relevant information about human impacts on water and ecological resources.
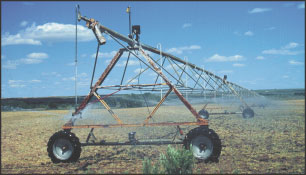 |
Center pivot irrigation system, Kansas. Photograph by Kevin F. Dennehy. |
| AccessibilityFOIAPrivacyPolicies and Notices | |
 |
|