Models can integrate information on chemical use, land use, and environmental factors to help explain water-quality conditions over broad geographic regions. One USGS model, based on nationwide data, was developed to estimate the risk of nitrate contamination to shallow ground water across the United States.(30) The model integrates nitrogen inputs and aquifer vulnerability by use of Geographic Information System (GIS) technology. Nitrogen inputs include commercial fertilizer and manure application rates, atmospheric contributions, and population densities (the latter representing residential and urban nitrogen sources, such as septic systems, fertilizers, and domestic animal waste). Aquifer vulnerability is represented by soil-drainage characteristics--the ease with which water and chemicals can seep to ground water--and the extent to which woodlands are interspersed with cropland.
Nitrate concentrations measured in the first 20 Study Units generally conform to the national risk map. Nitrate concentrations are expected to be lowest in the areas shown in green, where nitrogen inputs and aquifer vulnerability are lowest, and highest in the areas mapped in red, which represent regions where nitrogen inputs and aquifer vulnerability are highest. Anticipating where and what types of nitrate conditions exist can help focus regional or national water-management goals and monitoring strategies on the most vulnerable areas.
Use of the risk map to identify and prioritize contamination at a more detailed level than presented here is not advised because local variations in land use, irrigation practices, aquifer type, and rainfall can result in nitrate concentrations that do not conform to risk patterns shown at the national scale.
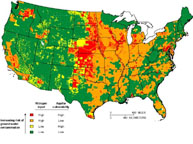 |
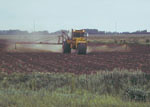
Areas with the highest risk for contamination of shallow ground water by nitrate generally have high nitrogen inputs to the land, well-drained soils, and a high ratio of cropland to woodland. |
Decades of monitoring may be necessary to adequately assess the effects of land- and water-management decisions on water quality. For example, decreases in phosphorus concentrations resulting from improved wastewater treatment technology and phosphate detergent bans have been documented in the Apalachicola-Chattahoochee-Flint River Basin; Albemarle-Pamlico Drainage; Connecticut, Housatonic, and Thames River Basins; Lower Susquehanna River Basin; Potomac River Basin, and Western Lake Michigan Drainages.
 |
 |
 |
|
|
|
|
 |
Removal of ammonia from point sources has enhanced stream quality in several Study Units, including the Connecticut, Housatonic, and Thames River Basins; Lower Susquehanna River Basin; Potomac River Basin; San Joaquin-Tulare Basins; and Trinity River Basin. Ammonia removal generally involves conversion to nitrate, and decreased ammonia concentrations typically have been accompanied by increased nitrate concentrations. Consequently, total nitrogen concentrations in these streams have remained about the same. Although toxicity to aquatic life has decreased as a result of ammonia removal, potential for eutrophication of surface waters probably has not changed.
 |
Little information exists about trends of nitrate in ground water, particularly at a national scale, because few monitoring programs have been designed to look at the quality of ground water over time. Some information on nitrate trends is available, however, for the Upper Snake River Basin and San Joaquin-Tulare Basins. Studies in the San Joaquin Valley indicate that from 1950 to 1980, the largest source of nitrate (nitrogen fertilizer) increased from 114 to 745 million pounds per year. Concentrations of nitrate in ground water also increased, from less than 2 mg/L in the 1950s to about 5 mg/L in the 1980s.
The effects of past and present land-use practices may take decades to become apparent in ground water. When weighing management decisions for protection of ground-water quality, it is important to consider the time lag between application of nitrogen to the land and arrival of nitrate at a well. This time lag generally decreases with increasing aquifer permeability and with decreasing depth to water. In response to reductions in nitrogen applications to the land, the quality of shallow ground water will improve before the quality of deep ground water, which could take decades.
 |
 |
| Nitrate concentrations have decreased in shallow ground water in parts of the Central Nebraska Basins. In the mid-1980s, the Central Platte Natural Resources District (CPNRD) established fertilizer management areas in part of the central Platte Valley, where nitrate concentrations were as high as 40 mg/L. Stringent guidelines were imposed on the timing and application rates of fertilizer in an area where the median nitrate concentration had increased from about 8 mg/L in 1974 to about 18 mg/L in 1986. In 1994, after implementation of the fertilizer management strategy, the median nitrate concentration decreased to less than 2 mg/L. It is important to note, however, that local variations in soil characteristics, amounts of recharge, and other factors affect responses to management strategies: nitrate concentrations in nearly 25 percent of the wells sampled by the CPNRD in the area with the most stringent guidelines continued to exceed 20 mg/L in 1994. |
| Pesticides | |
| Differences in occurrence and behavior of nutrients complicate prediction of effects and management options | |
| The Quality of Our Nation's Water--Nutrients and Pesticides |