
| Pressure transducers and high-water marks were used to document the inland water levels related to storm surge generated by Hurricane Rita in southwestern Louisiana and southeastern Texas. On September 22-23, 2005, an experimental monitoring network consisting of 47 pressure transducers (sensors) was deployed at 33 sites over an area of about 4,000 square miles to record the timing, extent, and magnitude of inland hurricane storm surge and coastal flooding. Sensors were programmed to record date and time, temperature, and barometric or water pressure. Water pressure was corrected for changes in barometric pressure and salinity. Elevation surveys using global-positioning systems and differential levels were used to relate all storm-surge water-level data, reference marks, benchmarks, sensor measuring points, and high-water marks to the North American Vertical Datum of 1988 (NAVD 88). The resulting data indicated that storm-surge water levels over 14 feet above NAVD 88 occurred at three locations and rates of water-level rise greater than 5 feet per hour occurred at three locations near the Louisiana coast. | |||||||||||||||||||||||||||||||||||||||||||||||||||||||||||||||||||||||||||||||||||||||||||||||||||||||||||||||||||||||||||||||||||||||||||||||||||||||||||||||||||||||||||||||||||||||||||||||||||||||||||||||||||||||||||||||||||||||||||||||||||||||||||||||||||||||||||||||||||||||||||||||||||
Quality-assurance measures were used to assess the variability and accuracy of the water-level data recorded by the sensors. Water-level data from sensors were similar to data from co-located sensors, permanent U.S. Geological Survey streamgages, and water-surface elevations performed by field staff. Water-level data from sensors at selected locations were compared to corresponding high-water mark elevations. In general, the water-level data from sensors were similar to elevations of high quality high-water marks, while reporting consistently higher than elevations of lesser quality high-water marks. |
|||||||||||||||||||||||||||||||||||||||||||||||||||||||||||||||||||||||||||||||||||||||||||||||||||||||||||||||||||||||||||||||||||||||||||||||||||||||||||||||||||||||||||||||||||||||||||||||||||||||||||||||||||||||||||||||||||||||||||||||||||||||||||||||||||||||||||||||||||||||||||||||||||
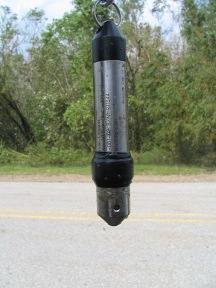
| As Hurricane Rita approached the Texas and Louisiana coasts (fig. 1), the U.S. Geological Survey (USGS) deployed an experimental monitoring network consisting of pressure transducers (sensors, fig. 2) to record the timing, extent, and magnitude of inland storm surge and coastal flooding. Storm surge associated with hurricanes occurs when winds push water up onto the shoreline. Storm surge can be intensified by sustained winds, low barometric pressure, excessive rainfall, and high tides. The network was situated east of the hurricane track and corresponded to the area of the coast where maximum storm surge was forecasted. | |||||||||||||||||||||||||||||||||||||||||||||||||||||||||||||||||||||||||||||||||||||||||||||||||||||||||||||||||||||||||||||||||||||||||||||||||||||||||||||||||||||||||||||||||||||||||||||||||||||||||||||||||||||||||||||||||||||||||||||||||||||||||||||||||||||||||||||||||||||||||||||||||||
|
|||||||||||||||||||||||||||||||||||||||||||||||||||||||||||||||||||||||||||||||||||||||||||||||||||||||||||||||||||||||||||||||||||||||||||||||||||||||||||||||||||||||||||||||||||||||||||||||||||||||||||||||||||||||||||||||||||||||||||||||||||||||||||||||||||||||||||||||||||||||||||||||||||
This report presents storm-surge data (hydrographs, tables, and digital files) from 47 sensors, including date and time, temperature, and pressure (barometric and water), and all adjusted water-pressure data to water-level elevations above the North American Vertical Datum of 1988 (NAVD 88). Also presented are high-water mark data from seven sites used to evaluate the accuracy of the computed water-level data. Water-level data from sensors are compared to data from co-located sensors, permanent USGS streamgages, water-surface elevations (commonly referred to as �tape downs�), and high-water mark elevations. |
|||||||||||||||||||||||||||||||||||||||||||||||||||||||||||||||||||||||||||||||||||||||||||||||||||||||||||||||||||||||||||||||||||||||||||||||||||||||||||||||||||||||||||||||||||||||||||||||||||||||||||||||||||||||||||||||||||||||||||||||||||||||||||||||||||||||||||||||||||||||||||||||||||
The study area is located in southwestern Louisiana and southeastern Texas and encompasses about 4,000 mi2 (figs. 1 and 3). It is generally bounded to the north by Interstate 10 (I-10); to the south by the Gulf of Mexico; to the east by the cities of Lafayette, Abbeville, and Intracoastal City, La.; and to the west by the cities of Beaumont, Port Arthur, and Sabine Pass, Tex. The study area is contained within the Coastal Prairies physiographic area, which is characterized by low-topographic relief and complexes of marsh and upland grasses and a small percentage of forested habitat (Partners In Flight, 2006). Most of these grassland habitats are utilized for agricultural purposes, primarily pasture land. Forested habitats occur primarily along river systems and on the coastal cheniers, which are long, narrow bands of hackberry-oak dominated woodlands that run parallel to the coast. The study area is sparsely populated outside the population centers of Lake Charles, Lafayette, and Sulphur, La., and Beaumont, Orange, and Port Arthur, Tex. |
|||||||||||||||||||||||||||||||||||||||||||||||||||||||||||||||||||||||||||||||||||||||||||||||||||||||||||||||||||||||||||||||||||||||||||||||||||||||||||||||||||||||||||||||||||||||||||||||||||||||||||||||||||||||||||||||||||||||||||||||||||||||||||||||||||||||||||||||||||||||||||||||||||
|
|||||||||||||||||||||||||||||||||||||||||||||||||||||||||||||||||||||||||||||||||||||||||||||||||||||||||||||||||||||||||||||||||||||||||||||||||||||||||||||||||||||||||||||||||||||||||||||||||||||||||||||||||||||||||||||||||||||||||||||||||||||||||||||||||||||||||||||||||||||||||||||||||||
The authors wish to thank the following USGS personnel for their dedication and diligence in the collecting, processing, and publishing data for this study: Joe G. Beauchamp, Christopher L. Braun, Marcus O. Gary, Robin H. Gary, and Joseph Vrabel, Texas Water Science Center; Christopher J. Rowden and Paul H. Rydlund, Missouri Water Science Center; Robert R. Mason, Jr., USGS Office of Surface Water, who provided general guidance for the project; and the personnel of the Ruston Program Office, Louisiana Water Science Center. |
|||||||||||||||||||||||||||||||||||||||||||||||||||||||||||||||||||||||||||||||||||||||||||||||||||||||||||||||||||||||||||||||||||||||||||||||||||||||||||||||||||||||||||||||||||||||||||||||||||||||||||||||||||||||||||||||||||||||||||||||||||||||||||||||||||||||||||||||||||||||||||||||||||
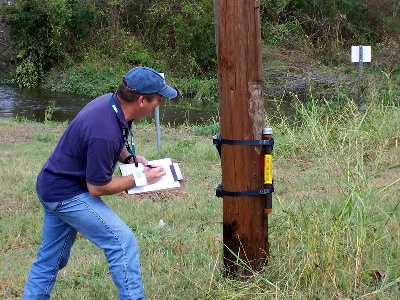
The storm-surge data-collection process consisted of sensor preparation and programming, sensor deployment, data correction, high-water mark identification, and elevation surveys. In the days prior to the landfall of Hurricane Rita, 47 Hobo sensors (models U20-001-01 and U20-001-02) were programmed to measure and record date and time, temperature, and pressure every 30 seconds during the storm and for several days afterward. Model U20-001-01 has a range of 0 to 30 ft and a typical accuracy of 0.1 percent of that range, or 0.03 ft (Onset Computer Corporation, 2006a); and model U20-001-02 has a range of 0 to 100 ft and a typical accuracy of 0.1 percent of that range, or 0.1 ft (Onset Computer Corporation, 2006b). Sensor housings were fabricated of 1.25-in. by 18-in. metal pipes configured with nylon ratchet straps so that the housings could be strapped to permanent objects, such as piers and power poles (fig. 4). USGS identification labels were affixed to all sensor housings prior to deployment. |
|||||||||||||||||||||||||||||||||||||||||||||||||||||||||||||||||||||||||||||||||||||||||||||||||||||||||||||||||||||||||||||||||||||||||||||||||||||||||||||||||||||||||||||||||||||||||||||||||||||||||||||||||||||||||||||||||||||||||||||||||||||||||||||||||||||||||||||||||||||||||||||||||||
Sensor deployment and data corrections, high-water mark determinations, and elevation surveys were conducted from September through November 2005. Elevation surveys were used to relate all data, including water-level data from inundated sensors, high-water marks, and water-surface elevations, to NAVD 88. |
|||||||||||||||||||||||||||||||||||||||||||||||||||||||||||||||||||||||||||||||||||||||||||||||||||||||||||||||||||||||||||||||||||||||||||||||||||||||||||||||||||||||||||||||||||||||||||||||||||||||||||||||||||||||||||||||||||||||||||||||||||||||||||||||||||||||||||||||||||||||||||||||||||
| Selection of sites to be instrumented was guided by Sea, Lake, and Overland Surges from Hurricanes (SLOSH) model (National Oceanic and Atmospheric Administration, 2006) output and local knowledge of roads, bridges, streams, piers, and other infrastructure, as well as topographic considerations. Some sites were chosen during deployment as storm and road conditions evolved and as opportunities for data coordination arose. The sensors were deployed at 33 sites during September 22-23, 2005, along selected waterways and in coastal marshes of the Louisiana and Texas coasts (fig. 3). Sensors were located from Sabine Pass through Abbeville at distances ranging from a few hundred feet from the coast to approximately 30 mi inland. Water-level sensors were deployed at elevations expected to be inundated, and barometric-pressure sensors were deployed at elevations that were not expected to be inundated. | |||||||||||||||||||||||||||||||||||||||||||||||||||||||||||||||||||||||||||||||||||||||||||||||||||||||||||||||||||||||||||||||||||||||||||||||||||||||||||||||||||||||||||||||||||||||||||||||||||||||||||||||||||||||||||||||||||||||||||||||||||||||||||||||||||||||||||||||||||||||||||||||||||
|
|||||||||||||||||||||||||||||||||||||||||||||||||||||||||||||||||||||||||||||||||||||||||||||||||||||||||||||||||||||||||||||||||||||||||||||||||||||||||||||||||||||||||||||||||||||||||||||||||||||||||||||||||||||||||||||||||||||||||||||||||||||||||||||||||||||||||||||||||||||||||||||||||||
Pressure data from inundated sensors were corrected for changes in barometric pressure using data from barometric-pressure sensors (equation 1). If a barometric-pressure sensor was not co-located with a water-level sensor, the data from the nearest barometric-pressure sensor was used to correct the water-level data. Water-level data from sensors also were corrected for salinity (water density) (equation 2). Corrections for salinity were based upon the location of the sensor in proximity to the coast. In general, sensors located in the southern part of the study area were categorized as saltwater (density of saltwater, 63.9887 lbs/ft3), sensors located in the middle were categorized as brackish (density of brackish water, 63.0522 lbs/ft3), and sensors located in the northern part of the study area were categorized as freshwater (density of freshwater, 62.4280 lbs/ft3). The extent of these areas is not exact but was indicated by field conductivity measurements and observations of the effect of high salinity on area flora and fauna. |
|||||||||||||||||||||||||||||||||||||||||||||||||||||||||||||||||||||||||||||||||||||||||||||||||||||||||||||||||||||||||||||||||||||||||||||||||||||||||||||||||||||||||||||||||||||||||||||||||||||||||||||||||||||||||||||||||||||||||||||||||||||||||||||||||||||||||||||||||||||||||||||||||||
|
|||||||||||||||||||||||||||||||||||||||||||||||||||||||||||||||||||||||||||||||||||||||||||||||||||||||||||||||||||||||||||||||||||||||||||||||||||||||||||||||||||||||||||||||||||||||||||||||||||||||||||||||||||||||||||||||||||||||||||||||||||||||||||||||||||||||||||||||||||||||||||||||||||
High-water marks were identified and flagged, where possible, immediately after the storm and during subsequent recovery activities. Identifying and qualifying high-water marks and determining how well these marks represent the peak often is subjective. High-water marks were qualified as excellent, good, fair, or poor depending upon the type of mark, such as debris, seed, mud, or stain; the spread or thickness of the mark; and whether the mark was created in a protected environment such as the interior wall of a building, or an unprotected environment such as an exposed bridge piling or fence post. |
|||||||||||||||||||||||||||||||||||||||||||||||||||||||||||||||||||||||||||||||||||||||||||||||||||||||||||||||||||||||||||||||||||||||||||||||||||||||||||||||||||||||||||||||||||||||||||||||||||||||||||||||||||||||||||||||||||||||||||||||||||||||||||||||||||||||||||||||||||||||||||||||||||
When available, benchmarks were used as permanent reference marks, and these benchmarks were related to sensor measurement points, high-water marks, and reference marks for water-surface elevations using differential-level surveys. When benchmarks were not available, temporary reference marks were established on permanent objects associated with each water-level sensor. Differential-level surveys then were used to relate the elevation of the sensors, high-water marks, and reference marks to the temporary reference marks. Graduated tapes were used to relate the elevation of the temporary reference marks to water-surface elevations during sensor recovery. |
|||||||||||||||||||||||||||||||||||||||||||||||||||||||||||||||||||||||||||||||||||||||||||||||||||||||||||||||||||||||||||||||||||||||||||||||||||||||||||||||||||||||||||||||||||||||||||||||||||||||||||||||||||||||||||||||||||||||||||||||||||||||||||||||||||||||||||||||||||||||||||||||||||
Global positioning systems (GPS) and differential-level surveys were used to determine the elevation of benchmarks and reference marks. Two first-order benchmarks and six National Geodetic Survey (NGS) Continuously Operating Reference Stations (CORS) (National Geodetic Survey, 2006a) were used to process GPS surveys. Three primary CORS, including TXGA (Galveston, Tex.), KJUN (Lafayette, La.), and LSUA (Alexandria, La.), were used as fixed locations to determine locations of newly established benchmarks and to reestablish position of existing benchmarks. These benchmarks were in turn held fixed during processing of all other reference marks. Each reference mark was surveyed statically for a minimum of 30 minutes and a maximum of 2 hours. Newly established and reestablished benchmarks were surveyed statically for one to several days. The initial survey point, benchmark 1001, was established using four days of data collected from early morning to sunset. |
|||||||||||||||||||||||||||||||||||||||||||||||||||||||||||||||||||||||||||||||||||||||||||||||||||||||||||||||||||||||||||||||||||||||||||||||||||||||||||||||||||||||||||||||||||||||||||||||||||||||||||||||||||||||||||||||||||||||||||||||||||||||||||||||||||||||||||||||||||||||||||||||||||
Global positioning systems data were processed by USGS personnel using Ashtech Solutions software (Ashtech Precision Products, 1999); high-order benchmarks, including permanent identifier (PID) numbers AV0079, AV0295, AV0360, AV0426, BK0241, BK0662, and BK1468 (National Geodetic Survey, 2006b); and the nearest six CORS, including TXGA, TXCN (Conroe, Tex.), TXBM (Beaumont, Tex.), KJUN, LSUA, and MCNE (Lake Charles, La.) (National Geodetic Survey, 2006a) for vertical and horizontal control. Vertical error expressed as 95 percent confidence values averaged 0.085 ft for all adjusted survey points, with a maximum of 0.207 ft. Horizontal and vertical positions for known NGS benchmarks were included several times in the surveys but not held as fixed to provide a check for accuracy. Differences between published and adjusted NGS benchmark locations are listed in table 1. The smallest attainable accuracy was 0.16 ft horizontal and 0.23 ft vertical. |
|||||||||||||||||||||||||||||||||||||||||||||||||||||||||||||||||||||||||||||||||||||||||||||||||||||||||||||||||||||||||||||||||||||||||||||||||||||||||||||||||||||||||||||||||||||||||||||||||||||||||||||||||||||||||||||||||||||||||||||||||||||||||||||||||||||||||||||||||||||||||||||||||||
Table 1. Differences between published and adjusted known National Geodetic Survey (NGS) locations used to check horizontal and vertical accuracies in southwestern Louisiana following Hurricane Rita, September 2005. |
|||||||||||||||||||||||||||||||||||||||||||||||||||||||||||||||||||||||||||||||||||||||||||||||||||||||||||||||||||||||||||||||||||||||||||||||||||||||||||||||||||||||||||||||||||||||||||||||||||||||||||||||||||||||||||||||||||||||||||||||||||||||||||||||||||||||||||||||||||||||||||||||||||
| [The elevations listed in table 1 were referenced to the North American Verical Datum of 1988 (NAVD 88); NGS PID, National Geodetic Survey Point Identifier] | |||||||||||||||||||||||||||||||||||||||||||||||||||||||||||||||||||||||||||||||||||||||||||||||||||||||||||||||||||||||||||||||||||||||||||||||||||||||||||||||||||||||||||||||||||||||||||||||||||||||||||||||||||||||||||||||||||||||||||||||||||||||||||||||||||||||||||||||||||||||||||||||||||
|
|||||||||||||||||||||||||||||||||||||||||||||||||||||||||||||||||||||||||||||||||||||||||||||||||||||||||||||||||||||||||||||||||||||||||||||||||||||||||||||||||||||||||||||||||||||||||||||||||||||||||||||||||||||||||||||||||||||||||||||||||||||||||||||||||||||||||||||||||||||||||||||||||||
Quality-assurance measures were used to assess the variability and confirm the accuracy of the recorded water-level data. These measures included (1) placing multiple sensors at two sites, (2) placing a sensor near an existing USGS streamgage, (3) checking water-surface elevations from reference marks by physical tape downs, and (4) comparing maximum water-surface elevations recorded by sensors to nearby high-water marks. |
|||||||||||||||||||||||||||||||||||||||||||||||||||||||||||||||||||||||||||||||||||||||||||||||||||||||||||||||||||||||||||||||||||||||||||||||||||||||||||||||||||||||||||||||||||||||||||||||||||||||||||||||||||||||||||||||||||||||||||||||||||||||||||||||||||||||||||||||||||||||||||||||||||
Multiple sensors were deployed at two sites, three sensors at site LF3, and two sensors at site LA7, to assess the variability between water-level data collected by co-located sensors. A review of data for these sites indicated excellent agreement. For example, water-level data from the three sensors at site LF3 were similar to one another during inundation and differences in water levels were within accuracy specifications of the sensors (fig. 5). |
|||||||||||||||||||||||||||||||||||||||||||||||||||||||||||||||||||||||||||||||||||||||||||||||||||||||||||||||||||||||||||||||||||||||||||||||||||||||||||||||||||||||||||||||||||||||||||||||||||||||||||||||||||||||||||||||||||||||||||||||||||||||||||||||||||||||||||||||||||||||||||||||||||
Sensors were deployed at two existing USGS streamgages, one each near sites LA2 and LA8, to assess the variability between water-level data from sensors and water-level data from USGS streamgages. Water-level data from the sensors tracked the water-level data from the streamgages quite well with no obvious departures or substantial lag. For example, water-level data from the inundated sensor at site LA2 were similar to water-level data from the streamgage, and differences in water-level data were within accuracy specification of the sensor (fig. 6). |
|||||||||||||||||||||||||||||||||||||||||||||||||||||||||||||||||||||||||||||||||||||||||||||||||||||||||||||||||||||||||||||||||||||||||||||||||||||||||||||||||||||||||||||||||||||||||||||||||||||||||||||||||||||||||||||||||||||||||||||||||||||||||||||||||||||||||||||||||||||||||||||||||||
|
|||||||||||||||||||||||||||||||||||||||||||||||||||||||||||||||||||||||||||||||||||||||||||||||||||||||||||||||||||||||||||||||||||||||||||||||||||||||||||||||||||||||||||||||||||||||||||||||||||||||||||||||||||||||||||||||||||||||||||||||||||||||||||||||||||||||||||||||||||||||||||||||||||
|
|||||||||||||||||||||||||||||||||||||||||||||||||||||||||||||||||||||||||||||||||||||||||||||||||||||||||||||||||||||||||||||||||||||||||||||||||||||||||||||||||||||||||||||||||||||||||||||||||||||||||||||||||||||||||||||||||||||||||||||||||||||||||||||||||||||||||||||||||||||||||||||||||||
Water-level data from sensors at seven sites, including LA2 (fig. 6), LA3, LA9, LC2a, LF3 (fig. 5), LC5, and LC8b, were compared to water-surface elevations collected after the hurricane. Water-surface elevations were determined by tape downs, which involves measuring the distance from a reference mark of known elevation to the water surface. Water-surface elevations agreed closely with water-level data from sensors for the same date and time. |
|||||||||||||||||||||||||||||||||||||||||||||||||||||||||||||||||||||||||||||||||||||||||||||||||||||||||||||||||||||||||||||||||||||||||||||||||||||||||||||||||||||||||||||||||||||||||||||||||||||||||||||||||||||||||||||||||||||||||||||||||||||||||||||||||||||||||||||||||||||||||||||||||||
As a final quality-assurance measure, water-level data from sensors at seven sites, including sites LA9b, LA12, LC2b, LC5, LC7, LC8a, and LF5 (table 2), were compared to the elevation of nearby high-water marks. In general, the highest recorded water levels from sensors were similar to elevations of high quality high-water marks and were higher than elevations of lesser quality high-water marks. For example, the highest recorded water level from the sensor at site LA9b was approximately 0.2 ft higher than the nearby high-water mark rated as excellent (fig. 7); the highest recorded water level from the sensor at site LC8a was approximately 1 ft higher than the nearby high-water mark rated as good (fig. 8); and the highest recorded water level from the sensor at site LF5 was approximately 1.9 ft higher than the nearby high-water mark rated as poor. |
|||||||||||||||||||||||||||||||||||||||||||||||||||||||||||||||||||||||||||||||||||||||||||||||||||||||||||||||||||||||||||||||||||||||||||||||||||||||||||||||||||||||||||||||||||||||||||||||||||||||||||||||||||||||||||||||||||||||||||||||||||||||||||||||||||||||||||||||||||||||||||||||||||
|
|||||||||||||||||||||||||||||||||||||||||||||||||||||||||||||||||||||||||||||||||||||||||||||||||||||||||||||||||||||||||||||||||||||||||||||||||||||||||||||||||||||||||||||||||||||||||||||||||||||||||||||||||||||||||||||||||||||||||||||||||||||||||||||||||||||||||||||||||||||||||||||||||||
|
|||||||||||||||||||||||||||||||||||||||||||||||||||||||||||||||||||||||||||||||||||||||||||||||||||||||||||||||||||||||||||||||||||||||||||||||||||||||||||||||||||||||||||||||||||||||||||||||||||||||||||||||||||||||||||||||||||||||||||||||||||||||||||||||||||||||||||||||||||||||||||||||||||
|
|||||||||||||||||||||||||||||||||||||||||||||||||||||||||||||||||||||||||||||||||||||||||||||||||||||||||||||||||||||||||||||||||||||||||||||||||||||||||||||||||||||||||||||||||||||||||||||||||||||||||||||||||||||||||||||||||||||||||||||||||||||||||||||||||||||||||||||||||||||||||||||||||||
Selected site location and characteristic data are summarized in table 3. Links from the table to the barometric-pressure and water-level time-series data are provided. Graphs showing barometric-pressure and water-level data before, during, and after landfall of Hurricane Rita also are provided (links to graphs are listed in table 3). |
|||||||||||||||||||||||||||||||||||||||||||||||||||||||||||||||||||||||||||||||||||||||||||||||||||||||||||||||||||||||||||||||||||||||||||||||||||||||||||||||||||||||||||||||||||||||||||||||||||||||||||||||||||||||||||||||||||||||||||||||||||||||||||||||||||||||||||||||||||||||||||||||||||
|
|||||||||||||||||||||||||||||||||||||||||||||||||||||||||||||||||||||||||||||||||||||||||||||||||||||||||||||||||||||||||||||||||||||||||||||||||||||||||||||||||||||||||||||||||||||||||||||||||||||||||||||||||||||||||||||||||||||||||||||||||||||||||||||||||||||||||||||||||||||||||||||||||||
A review of the highest water level from the sensors indicates that storm-surge elevations were highest east of the Sabine River into southwestern Louisiana nearest the path of the storm. The highest water levels were recorded at most sites during the morning of September 24; however, several sites on rivers in the northern parts of the study area recorded maximum water levels two or more days after Hurricane Rita made landfall. Maximum water levels were recorded at several coastal sites more than one hour prior to Hurricane Rita making landfall. The highest water levels were recorded at an elevation of 14.90 ft above NAVD 88 near Constance Beach, La., (site LC11), 14.83 ft above NAVD 88 near Creole, La. (site LA12), and 14.68 ft above NAVD 88 near Grand Chenier (site LA11), La., about 20 mi, 48 mi, and 54 mi east of Sabine Pass, Tex., respectively (fig. 3, table 3). Flooding at some locations near I-10, such as site LA3 and LA2, was increased by river flows in addition to storm surge. |
|||||||||||||||||||||||||||||||||||||||||||||||||||||||||||||||||||||||||||||||||||||||||||||||||||||||||||||||||||||||||||||||||||||||||||||||||||||||||||||||||||||||||||||||||||||||||||||||||||||||||||||||||||||||||||||||||||||||||||||||||||||||||||||||||||||||||||||||||||||||||||||||||||
| Water-level rises greater than 5 ft/hr were recorded by sensors at three sites: LC9, LC8b, and LA10. The maximum rate of water-level rise was approximately 5.8 ft/hr at site LC9 about 10 mi west of Cameron, Louisiana. The minimum rate of water-level rise was approximately 0.1 ft/hr recorded near Lake Arthur (site LA7), La., located in the northeastern part of the study area. | |||||||||||||||||||||||||||||||||||||||||||||||||||||||||||||||||||||||||||||||||||||||||||||||||||||||||||||||||||||||||||||||||||||||||||||||||||||||||||||||||||||||||||||||||||||||||||||||||||||||||||||||||||||||||||||||||||||||||||||||||||||||||||||||||||||||||||||||||||||||||||||||||||
Before Hurricane Rita made landfall near southeastern Texas and southwestern Louisiana, 47 pressure transducers (sensors) were deployed at 33 sites from September 22-23, 2005, along and inland of the Gulf Coast to monitor the timing, extent, and magnitude of storm surge and inland flooding. Substantial inundation occurred at sensors placed at 24 of these sites. The study area, which covered about 4,000 square miles, extended east from the Sabine River on the Texas and Louisiana border to Lafayette, Louisiana, and inland from the coast approximately 30 miles. |
|||||||||||||||||||||||||||||||||||||||||||||||||||||||||||||||||||||||||||||||||||||||||||||||||||||||||||||||||||||||||||||||||||||||||||||||||||||||||||||||||||||||||||||||||||||||||||||||||||||||||||||||||||||||||||||||||||||||||||||||||||||||||||||||||||||||||||||||||||||||||||||||||||
Sensors recorded date and time, temperature, and pressure (water or barometric) on a 30-second interval before and during the storm and for several days afterward. Pressure data from inundated sensors were corrected for changes in barometric pressure and salinity. Elevations for storm-surge data, including reference marks, benchmarks, sensor measuring points, and high-water marks, were related to the North American Vertical Datum of 1988 (NAVD 88) using global positioning systems, differential levels, and graduated tapes. |
|||||||||||||||||||||||||||||||||||||||||||||||||||||||||||||||||||||||||||||||||||||||||||||||||||||||||||||||||||||||||||||||||||||||||||||||||||||||||||||||||||||||||||||||||||||||||||||||||||||||||||||||||||||||||||||||||||||||||||||||||||||||||||||||||||||||||||||||||||||||||||||||||||
The results of the quality-assurance measures indicated that water levels recorded by the sensors were similar to water levels recorded by co-located sensors, water levels recorded by nearby U.S. Geological Survey streamgages, and elevations of water surface and high-water marks determined at selected sites. In general, water-level data were similar to high-water marks of high quality; however, water-level data were consistently higher than the elevations of high-water marks of lesser quality, differing by a foot or more at some sites. |
|||||||||||||||||||||||||||||||||||||||||||||||||||||||||||||||||||||||||||||||||||||||||||||||||||||||||||||||||||||||||||||||||||||||||||||||||||||||||||||||||||||||||||||||||||||||||||||||||||||||||||||||||||||||||||||||||||||||||||||||||||||||||||||||||||||||||||||||||||||||||||||||||||
The highest water levels were caused by storm surge and were recorded by sensors at sites near the coast. Water levels over 14 feet above NAVD 88 were recorded at three sites along the Louisiana Gulf Coast. The maximum water level occurred near Constance Beach, La., at an elevation of 14.90 feet above NAVD 88. In general, water levels increased east of the Sabine River into southwestern Louisiana. Lesser effects of storm surge were recorded inland through the approximate latitude of Interstate 10. Rates of water-level rises were recorded by sensors in excess of 5 feet per hour at three locations near the Louisiana coast. The maximum rate of water-level rise was approximately 5.8 feet per hour in the southern part of the study area, and the minimum rate was approximately 0.1 feet per hour in the northeastern part of the study area. The maximum water levels were recorded at several coastal sites more than one hour prior to Hurricane Rita making landfall during the morning of September 24. |
|||||||||||||||||||||||||||||||||||||||||||||||||||||||||||||||||||||||||||||||||||||||||||||||||||||||||||||||||||||||||||||||||||||||||||||||||||||||||||||||||||||||||||||||||||||||||||||||||||||||||||||||||||||||||||||||||||||||||||||||||||||||||||||||||||||||||||||||||||||||||||||||||||
Ashtech Precision Products, 1999, Ashtech solution user�s guide: Santa Clara, Calif., Magellan Corporation, 170 p. National Aeronautics and Space Administration (NASA), 2006, Moderate resolution imaging spectroradiometer (MODIS), NASA, accessed May 16, 2006, at URL http://www.nasa.gov/vision/earth/lookingatearth/h2005_rita.html National Geodetic Survey, 2006a, National Geodetic Survey continuously operating reference station (CORS): National Geodetic Survey and National Oceanic and Atmospheric Administration, accessed May 16, 2006, at URL http://www.ngs.noaa.gov/CORS/>http://www.ngs.noaa.gov/CORS/">http://www.ngs.noaa.gov/CORS/ National Geodetic Survey, 2006b, National Geodetic Survey datasheet retrieval page: National Geodetic Survey and National Oceanic and Atmospheric Administration, accessed May 16, 2006, at URL http://www.ngs.noaa.gov/cgi-bin/datasheet.prl National Oceanic and Atmospheric Administration, 2006, National Hurricane Center: Hurricane preparedness, SLOSH model, accessed September 21, 2005, at URL http://www.nhc.noaa.gov/HAW2/english/surge/slosh.shtml Onset Computer Corporation, 2006a, Product manual for U20-001-01 HOBO water level data logger (0 - 30ft): Cape Cod, MA., Onset Computer Corporation, accessed May 16, 2006, at URL http://www.onsetcomp.com/Support/manual_pdfs/8976_F_MAN_U20_001_01.pdf Onset Computer Corporation, 2006b, Product manual for U20-001-02 HOBO water level data logger (0 - 100ft): Cape Cod, MA., Onset Computer Corporation, accessed May 16, 2006, at URL http://www.onsetcomp.com/Support/manual_pdfs/8977_D_MAN_U20_001_02.pdf Partners in Flight, 2006, Partners in Flight U.S. Bird Conservation Plans, Physiographic areas plans, coastal prairies, Executive Summary, accessed April 24, 2006 at URL http://www.blm.gov/wildlife/pl_06sum.htm |
|||||||||||||||||||||||||||||||||||||||||||||||||||||||||||||||||||||||||||||||||||||||||||||||||||||||||||||||||||||||||||||||||||||||||||||||||||||||||||||||||||||||||||||||||||||||||||||||||||||||||||||||||||||||||||||||||||||||||||||||||||||||||||||||||||||||||||||||||||||||||||||||||||
