Link to USGS home page.
Oregon Water Science Center

Total Dissolved Gas and Water Temperature in the Lower Columbia River, Oregon and Washington, 2006: Quality-Assurance Data and Comparison to Water-Quality Standards

By Dwight Q. Tanner, Heather M. Bragg, and Matthew W. Johnston

U.S. Geological Survey Data Series 235

Prepared in cooperation with the U.S. Army Corps of Engineers

ONLINE ONLY (download the report)

When water is released through the spillways of dams, air is entrained, increasing the downstream concentration of dissolved gases. Excess dissolved-gas concentrations can have adverse effects on freshwater aquatic life. The U.S. Geological Survey (USGS), in cooperation with the U.S. Army Corps of Engineers, collected dissolved-gas concentration and water-temperature data at eight stations on the lower Columbia River in 2006. Significant findings from the data include:

  • Variances to the Oregon and Washington water-quality standards for total dissolved gas were exceeded at all of the monitoring stations: Cascade Island (67 days), Camas (60 days), Bonneville forebay (51 days), The Dalles forebay (36 days), John Day tailwater (35 days), John Day navigation lock (20 days), The Dalles tailwater (8 days), and Warrendale (4 days).
Bonneville Dam

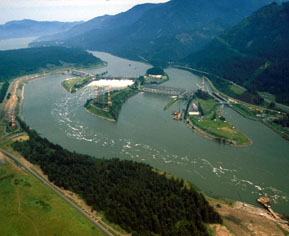
Bonneville Dam on the Columbia River

Calibrating a dissolved-gas monitor

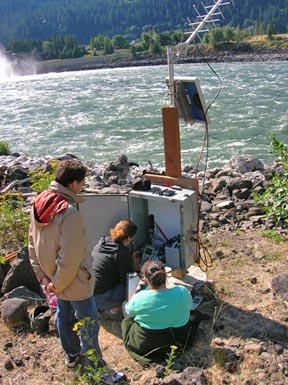
USGS scientists calibrate a dissolved-gas monitor downstream from the Bonneville Dam spillway

  • From early July to the end of August 2006, water temperature was above 20°C (degrees Celsius) at each of the eight lower Columbia River stations. According to the Oregon temperature standard, the 7-day average maximum temperature of the lower Columbia River should not exceed 20 °C; Washington regulations state that the 1-day maximum should not exceed 20°C due to human activities.

  • Most field checks of total-dissolved-gas sensors with a secondary standard were within ± (plus or minus) 1% saturation. All of the field checks of barometric pressure were within ±1 millimeter of mercury of a secondary standard, and water temperature field checks were all within ±0.2°C.

  • For the eight monitoring stations in water year 2006, an average of 99.1% of the total-dissolved-gas data were received in real time by the USGS satellite downlink and were within 1% saturation of the expected value on the basis of calibration data, replicate quality-control measurements in the river, and comparison to ambient river conditions at adjacent stations.

Download the report (PDF, 1.5 MB) (Adobe Reader® required; version 5 or higher preferred. If you do not have the Adobe PDF Reader, it is available for free download from Adobe Systems Incorporated.)

Contents

Introduction
Background
Purpose and Scope
Methods of Data Collection
Summary of Total-Dissolved-Gas Data Completeness and Quality
Quality Assurance Data
Effects of Spill on Total-Dissolved-Gas Concentration
Comparison of Total Dissolved Gas and Temperature to Standards
References Cited


Document Accessibility: Adobe Systems Incorporated has information about PDFs and the visually impaired. This information provides tools to help make PDF files accessible. These tools convert Adobe PDF documents into HTML or ASCII text, which then can be read by screen-reading programs that synthesize text as audible speech. In addition, a version of Adobe Reader that contains support for screen readers is available. The conversion tools and the accessible reader may be obtained free from Adobe through their conversion tools Web site.


For information on ordering Oregon Water Science Center publications, click on this link.

To learn more about USGS activities in Oregon, please visit our home page.


Accessibility FOIA Privacy Policies and Notices

Take Pride in America home page. FirstGov button U.S. Department of the Interior | U.S. Geological Survey
Persistent URL: https://pubs.water.usgs.gov/ds235
Page Contact Information: USGS Publishing Network
Page Last Modified: Monday, 28-Nov-2016 12:04:39 EST