U.S. Geological Survey - Data Series 240
Data Series 240
U.S. Department of the Interior
U.S. Geological Survey
| Multiply | By | To obtain |
|---|---|---|
| Length | ||
| inch(in) | 2.54 | centimeter (cm) |
| foot (ft) | 0.3048 | meter (m) |
| mile (mi) | 1.609 | kilometer (km) |
| area | ||
| square mile (mi2) | 259.0 | hectare (ha) |
Horizontal coordinate information is referenced to the North American Datum of 1983 (NAD83).
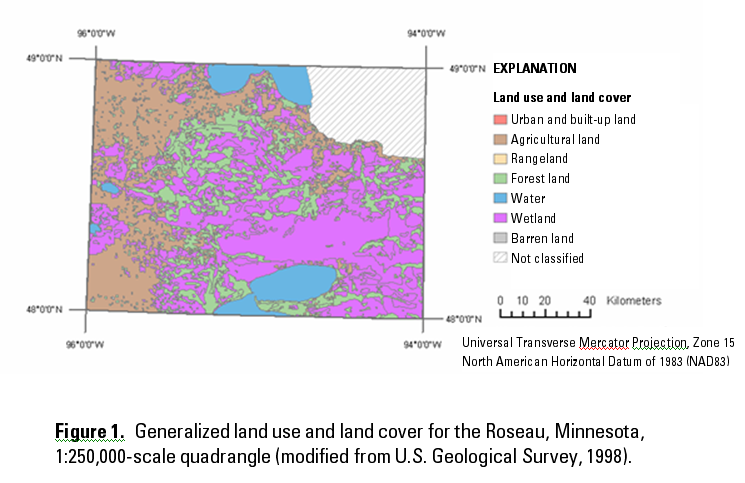
The USGS developed the Geographic Information Retrieval and Analysis System (GIRAS) software (Mitchell and others, 1977) to digitize, edit, and produce cartographic and statistical output from the mapped information. The acronym "GIRAS" has been used informally over the years to refer to the software system, its digital file storage format, and the land-use and land-cover data set (only one of many GIRAS layers) created using the software. The data are currently (2006) distributed by the USGS in the original GIRAS file format on the World Wide Web (Fegeas and others, 1983; U.S. Geological Survey, 1998). In this report, "GIRAS" will be used to refer to the digital GIRAS-format files, and "LULC" will refer to the land-use and land-cover polygon data. A map showing a LULC data set for a single 1:250,000-scale quadrangle is shown in figure 1.
In the early 1990s, the USGS developed a procedure to convert the LULC data set to ArcInfo polygon coverage format so it could be easily used for geographic information system (GIS) analysis supporting water-resources applications. The U.S. Environmental Protection Agency (USEPA) was interested in using these data in ArcInfo format and worked with USGS to convert all of the quadrangles using the USGS-developed software programs (GIRASARC.AML and GIRASNEAT.AML). The conversion process included (1) converting the data from GIRAS to ArcInfo coverage format, (2) scaling the data to true Universal Transverse Mercator (UTM) coordinates from the 16-bit coordinate system used in the GIRAS files, (3) changing the coordinate system from UTM coordinates to Albers Equal-Area coordinates, (4) inserting 1:100,000 scale information where available to create a single combined data set for each 1:250,000 scale quadrangle tile, and (5) removing polygon areas that fell outside the quadrangle boundary. USEPA posted the data (in ArcInfo™ EXPORT format) on its FTP site in 1994, and later on its Web site (U.S. Environmental Protection Agency, 1994).
In the early 1990s, the USGS began to use the LULC data to characterize watersheds and other areas studied by the National Water-Quality Assessment Program (NAWQA) Program (Gilliom and others, 1995). As NAWQA researchers began working with the LULC data on a national scale, they noticed that minor errors existed in the EPAGIRAS national data set. Some of these errors existed in the original GIRAS data files, and some were minor problems introduced during the conversion from GIRAS to ArcInfo format. A comprehensive effort was made at that time to download all the EPAGIRAS data sets and fix some of the obvious errors in the data. In the few cases where the ArcInfo files were unusable, some of the original USGS GIRAS files were downloaded and processed into ArcInfo coverage format to match the EPAGIRAS data sets.
This "NAWQA version" of the LULC data set has been used in several NAWQA applications for planning and data analysis. A method was developed to estimate new residential areas by combining the LULC data with U.S. Census population data compiled at the block-group level (Hitt, 1994). Gilliom and Thelin (1997) used this information together with agricultural census data from the U.S. Department of Agriculture to map agricultural land to be used in water-quality assessments. Stewart (1998) developed a land-cover data update algorithm based on a combination of the GIRAS data and a digital land-cover classification based on satellite imagery.
Although the quality of the NAWQA version of the LULC data set was sufficient for the above analyses, it still included polygon coding errors and data gaps where polygons did not meet exactly at the quadrangle boundary. The USGS implemented GIS processing steps to enhance the NAWQA version of the LULC data set, and created additional polygon data sets that document the land-cover data sources in a geographic context (Price, and others, 2003). This report documents these data sets and includes them in commonly used GIS data file formats.
![Figure 2. Flow diagram describing data processing for development of enhanced land-use and land-cover data sets (shown in red boxes). [USGS, U.S. Geological Survey; GIRAS, Geographic Information Retrieval and Analysis System; EPAGIRAS, U.S. Environmental Protection Agency GIRAS files; NAWQA, National Water-Quality Assessment Program; LULC, land-use and land cover; NAD27, North American Datum of 1927; NAD83, North American Datum of 1983; TIFF, Tagged Image File Format]](/ds/2006/240/fig2.png)
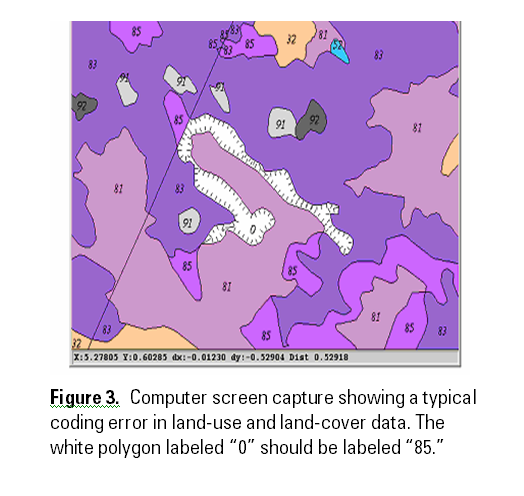
Arc Macro Language (AML) software was developed to aid in interactive
checking and repair of LULC data for coding errors. The older Arc
Workstation software (Environmental Systems Research Institute, 2002)
was selected for this application because of its easier-to-use AML
scripting environment and better support of ArcInfo coverage editing
than newer ArcGIS software. The application allowed users to navigate by
mouse clicks through all the polygons that had missing or incorrect
land-use codes and correct them. The application also included buttons
to display two reference data sets in the background: (1) a point
coverage of all of the original labels in the GIRAS files (unmodified by
GIS polygon processing operations), and (2) the 1992 National Land Cover
Data Set (Vogelmann and others, 2001; U.S. Geological Survey, 2002). In
rare situations where the proper land-use code was not clear from the
context of the land use of the surrounding polygons, the reference data
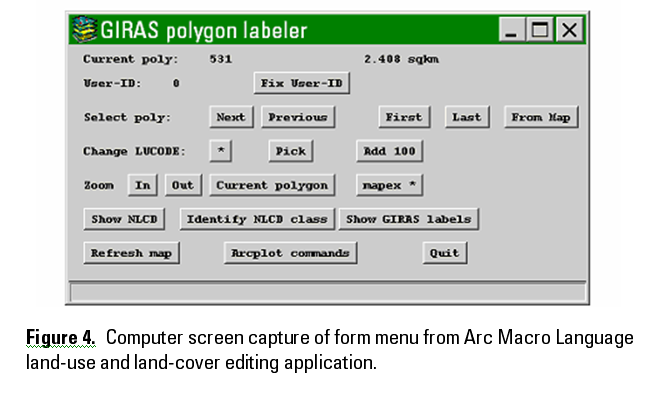
sets were used to help select an appropriate code. A form menu from the
AML application is shown in figure 4. A few of the land-use coding
errors caused by missing polygon boundaries required the editing of the
polygon boundaries to split a single polygon into one or more parts.
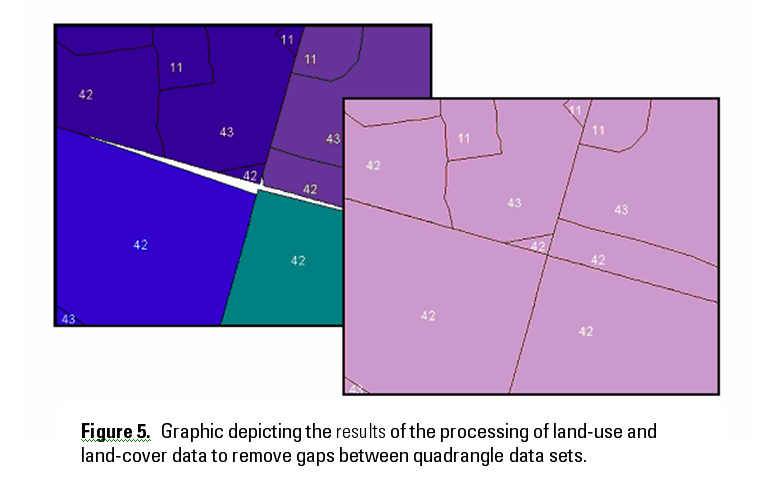
 A non-interactive process, also in the form of an AML program, was
developed to refine the "neatline" processing that had been previously
applied in the development of the EPAGIRAS data set. This processing
basically re-clipped the data to the North American Datum of 1927
(NAD27) quadrangle boundary and extended the polygons to the quadrangle
boundary to fill any gaps. The polygons were extended using a hybrid
raster/vector algorithm to extend the land-use polygons by filling to
the quadrangle boundary. The result was a set of GIRAS quadrangle
coverages with outside boundaries matching the 1:250,000-scale
quadrangle boundaries. This processing was required to allow the
quadrangles to fit together with no gaps or overlaps, so that the
coverages could be easily combined (fig. 5).
A non-interactive process, also in the form of an AML program, was
developed to refine the "neatline" processing that had been previously
applied in the development of the EPAGIRAS data set. This processing
basically re-clipped the data to the North American Datum of 1927
(NAD27) quadrangle boundary and extended the polygons to the quadrangle
boundary to fill any gaps. The polygons were extended using a hybrid
raster/vector algorithm to extend the land-use polygons by filling to
the quadrangle boundary. The result was a set of GIRAS quadrangle
coverages with outside boundaries matching the 1:250,000-scale
quadrangle boundaries. This processing was required to allow the
quadrangles to fit together with no gaps or overlaps, so that the
coverages could be easily combined (fig. 5).
The shapefiles were named using a spatially based naming convention to simplify data access; for example, G39083 is the data set with its lower left corner located at 39 degrees south latitude and 83 degrees west longitude. The data were projected into geographic coordinates referenced to the NAD83 datum and converted to shapefile format.
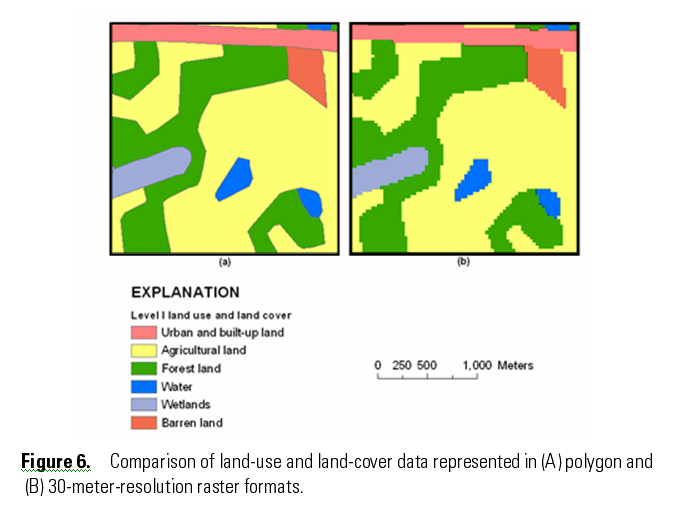
The set of ArcInfo coverages was converted to a raster data set with
30-meter grid spacing, using a gridded coordinate system designed to
align precisely with the National Land Cover Data Set (Vogelmann, 2001)
for use in applications that combine the two data sets. The 30-meter
grid cell spacing captures most of the detail in the LULC data (fig. 6).
The raster data set has been saved in six TIFF-format images that
include geographic referencing. The six raster data sets cover four
tiles (NW, NE, SW, and SE) over the conterminous United States, with a
raster data set each for Alaska and Hawaii. The Alaska and Hawaii raster
data sets are stored in Universal Transverse Mercator (UTM) coordinates.
The original GIRAS files included documentation (metadata) in the header records of each data file that recorded various details about the GIRAS file. These included the title of the map sheet, the nominal scale of the map sheet (1:250,000 or 1:100,000), the data file creation date, and the date of the source materials (aerial photographs) used to create the land-use and land-cover data. All of this information was either incomplete or not easily available in the land-use and land-cover data files in ArcInfo format, so a complete download of the raw GIRAS files was made from the USGS Earth Resources Observation and Science Data Center, and a polygon coverage ("src_poly") was created from this information that represents the metadata as polygon attributes. In addition, a polygon data set ("tilepoly") was created documenting the extent of each of the 471 tiles. This separate tilepoly data set was required because many of the land-use and land-cover data coverage tiles were created from several different GIRAS files, some of which have different source dates.
This is a collection of 471 polygon shapefiles of land use and land cover published by the USGS, with minor attribute and geometric edits.
This is a collection of six image files (in TIFF format) that represent the same land use and land cover information contained in the shapefiles. However, the polygon areas are represented as 30-meter-resolution gridded data sets referenced to Albers Equal-Area map coordinates (conterminous United States) or UTM map coordinates (Alaska and Hawaii), NAD83.
These polygon features contain information about the source information, which was extracted from the GIRAS format files currently available online from the USGS.
These polygon features represent the spatial extent of each of the land-use and land-cover shapefiles released in this report.
Anderson, J.R., Hardy, E.E., Roach J.T., and Witmer R.E., 1976, A land use and land cover classification system for use with remote sensor data: U.S. Geological Survey Professional Paper 964, 28 p., http://pubs.er.usgs.gov/pubs/pp/pp964
Environmental Systems Research Institute, 1998, ESRI Shapefile Technical Description, Redlands, Calif., Redlands, Calif., accessed Dember 26, 2006 at http://www.esri.com/library/whitepapers/pdfs/shapefile.pdf
Environmental Systems Research Institute, 2002, ArcInfo Workstation ArcDoc: Redlands, Calif., [on-line documentation].
Fegeas, R.G., Claire, R.W., Guptill, S.C., Anderson, K.E., and Hallam, C.A., 1983, U.S. Geological Survey digital cartographic data standards—Land use and land cover digital data: U.S. Geological Survey Circular 895-E, 21 p., http://pubs.er.usgs.gov/pubs/cir/cir895E
Gilliom, R.J., Alley, W.M., and Gurtz, M.E., 1995, Design of the National Water-Quality Assessment Program; occurrence and distribution of water-quality conditions: U.S. Geological Survey Circular 1112, 33 p., http://pubs.er.usgs.gov/pubs/cir/cir1112
Gilliom, R.J., and Thelin, G.P., 1997, Classification and mapping of agricultural land for national water-quality assessment: U.S. Geological Survey Circular 1131, 70 p., http://pubs.er.usgs.gov/pubs/cir/cir1131
Hitt, K.J., 1994, Refining 1970's land-use data with 1990 population data to indicate new residential development: U.S. Geological Survey Water-Resources Investigations Report 94-4250, 12 p., http://pubs.er.usgs.gov/pubs/wri/wri944250
Mitchell, W.W., Guptill, S.C., Anderson, K.E., Fegeas, R.G., and Hallam, C.A., 1977, GIRAS—A geographic information analysis system for handling land use and land cover data: U.S. Geological Survey Professional Paper 1059, 16 p., http://pubs.er.usgs.gov/pubs/pp/pp1059
Price, C., Nakagaki, N., Hitt, K.J., and Clawges, R., 2003, Mining GIRAS—Improving on a national treasure of land use data, in: Proceedings of the 23rd ESRI International Users Conference, July 7–11, 2003: Redlands, Calif., 11 p., accessed December 26, 2006, at http://gis.esri.com/library/userconf/proc03/p0904.pdf
Stewart, J.S., 1998, Combining satellite data with ancillary data to produce a refined land-use/land-cover map: U.S. Geological Survey Water-Resources Investigations Report 97-4203, 11 p., http://pubs.er.usgs.gov/pubs/wri/wri974203
U.S. Environmental Protection Agency, 1994, U.S. Geological Survey GIRAS land use and land cover data [digital files in ArcInfo format], accessed July 1, 2005, at http://www.epa.gov/ngispgm3/spdata/EPAGIRAS
U.S. Geological Survey, 1998, Land use and land cover digital data from 1:250,000- and 1:100,000-scale maps [on-line digital data], accessed December 26, 2006, at http://edc.usgs.gov/products/landcover/lulc.html
U.S. Geological Survey, 2002, National Land Cover Data Set, [on-line digital data], accessed July 1, 2005, at ftp://edcftp.cr.usgs.gov/pub/data/landcover/states
U.S. Library of Congress, 2006, TIFF, Revision 6.0, in: Sustainability of Digital Formats: Planning for Library of Congress Collections [on-line compilation], accessed December 26, 2006, at http://www.digitalpreservation.gov/formats/fdd/descriptions.shtml
Vogelmann, J.E., Howard, S.M., Yang, L., Larson, C.R., Wylie, B.K., and Van Driel, N., 2001, Completion of the 1990’s National Land Cover Data Set for the conterminous United States from Landsat Thematic Mapper data and ancillary data sources: Photogrammetric Engineering and Remote Sensing, v. 67, p. 650–662, accessed July 1, 2005, at http://www.asprs.org/publications/pers/2001journal/june/highlight.html
Document accessiblity: These digital geospatial data files contain large amounts of geographic data that cannot be easily accessed by the visually impaired. If you have any questions about accessibility, please contact the author.
Send questions or comments about this report
For more information about the National Water Quality Assessment Program visit the NAWQA home page.
| USGS | Biology | Geology | Geography | Water | USGS Data Series | Water Related Reports |

![]() U.S. Department of the Interior |
U.S. Geological Survey
U.S. Department of the Interior |
U.S. Geological Survey
URL: https://pubs.usgs.gov/ds/2006/240/
Page Contact Information: Water Webserver Team
Page Last Modified: 13:50:00 Thu 12 Apr 2007
