U.S. Geological Survey Data Series 310
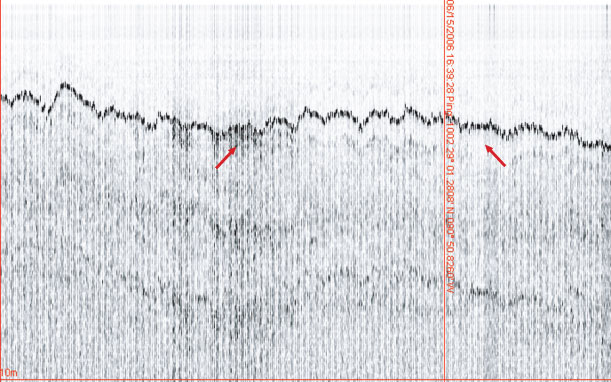
Figure 2. Example of vertical striping caused by acquisition software malfunctions occurring during data collection. Red arrows indicate positions of some of the anomalies, which illustrated a discontinous, random pattern throughout the seismic profiles.