U.S. Geological Survey Data Series 370
1U.S. Geological Survey, St. Petersburg, FL 33701.
2Jacobs Technology Inc., St. Petersburg, FL 33701.
U.S. Department of the Interior
U.S. Geological Survey
Florida Integrated Science Center - St. Petersburg
Publications are available from USGS Information Services, Box 25286, Federal Center, Denver, CO 80225-0046 (telephone 1-888-ASK-USGS; e-mail: infoservices@usgs.gov).
Page Contents: |
|||
 |
|||
This DVD publication was prepared by an agency of the United States Government. Although these data have been processed successfully on a computer system at the U.S. Geological Survey, no warranty expressed or implied is made regarding the display or utility of the data on any other system, nor shall the act of distribution imply any such warranty. The U.S. Geological Survey shall not be held liable for improper or incorrect use of the data described and (or) contained herein. Reference herein to any specific commercial product, process, or service by trade name, trademark, manufacturer, or otherwise does not constitute or imply its endorsement, recommendation, or favoring by the United States Government or any agency thereof.
This disc is readable on any computing platform that has standard DVD driver software installed. The minimum software requirements are a Web browser, Adobe Reader, Microsoft Exel, and a text editor. If you cannot fully access the information on this page, please contact USGS Information Services at infoservices@usgs.gov or 1-888-ASK-USGS.
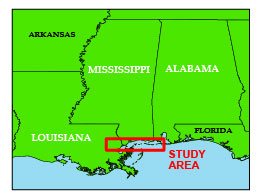
In June and August of 1992, the U.S. Geological Survey (USGS) conducted geophysical surveys to investigate the shallow geologic framework from Lake Pontchartrain, Louisiana, to Mobile Bay, Alabama. This work was conducted onboard the Argonne National Laboratory’s R/V ERDA-1 as part of the Mississippi/Alabama Pollution Project. This report is part of a series to digitally archive the legacy analog data collected from the Mississippi-Alabama SHelf (MASH). The MASH data rescue project is a cooperative effort by the USGS and the Minerals Management Service (MMS).
A standardized naming convention was established to allow for better management of scanned trackline images within the MASH data rescue project. Each cruise received a unique field activity ID based on the year the data were collected, the first two digits of the survey vessel name, and the number of cruises made (to date) by that vessel that year (i.e. 92ER2 represents the second cruise made by the R/V ERDA-1 in 1992.) The new field activity IDs 92ER2 and 92ER4 presented in this report were originally referred to as ERDA 92-2 and ERDA 92-4 at the USGS in St. Petersburg, FL, and 92010 and 92037 at the USGS in Woods Hole, MA. A table showing the naming convention lineage for cruise IDs in the MASH data rescue series is included as a PDF. This report serves as an archive of high resolution scanned Tagged Image File Format (TIFF) and Graphics Interchange Format (GIF) images of the original boomer paper records, navigation files, trackline maps, Geographic Information System (GIS) files, cruise logs, and formal Federal Geographic Data Committee (FGDC) metadata for cruises 92ER2 and 92ER4.
The boomer system uses an acoustic energy source called a plate, which consists of capacitors charged to a high voltage and discharged through a transducer in the water. The source is towed on a sled, at sea level, and when discharged emits a short acoustic pulse, or shot, which propagates through the water and sediment column. The acoustic energy is reflected at density boundaries (such as the seafloor or sediment layers beneath the seafloor), detected by the hydrophone receiver, and the amplitude of the reflected energy is recorded by an Edward P. Curley Lab (EPC) thermal plotter. This process is repeated at timed intervals (for example, 0.5 s) and recorded for specific intervals of time (for example, 100 ms). The timed intervals are also referred to as the shot interval or fire rate. On analog records, the recorded interval is referred to as the sweep, which is the amount of time the recorder stylus takes to sweep from the top of the record to the bottom of the record, thereby recording the amplitude of the reflected energy of one shot. In this way, consecutive recorded shots produce a two-dimensional (2-D) vertical image of the shallow geologic structure beneath the ship track.
Many of the geophysical data collected by the USGS prior to the late 1990s were recorded in analog format and stored as paper copies. Scientists onboard made hand-written annotations onto these records to note latitude and longitude, time, line number, course heading, and geographic points of reference. Each paper roll typically contained numerous survey lines and could reach more than 90 ft in length. All rolls are stored at the USGS FISC-St. Petersburg, FL. To preserve the integrity of these records and improve accessibility, analog holdings were converted to digital files.
Paper records were scanned at 200 dpi using an IDEAL/Contex Crystal TX 40" (1394) large-format scanner and converted to TIFF format using WIDEimage software (version 2.8.1) in the black and white adaptive mode. Whole roll TIFF images of multiple lines were manually cropped into individual survey lines using WIDEimage. Line images longer than 30,000 pixels were separated into smaller segments for editing with Adobe Photoshop CS2 where a metadata header file was appended to each survey line or line segment. Images of individual survey lines were named by combining the MASH cruise ID with the survey line (or trackline) number using an underscore, for example, 92ER2_1. If survey lines were longer than 30,000 pixels the split segments were identified by appending a letter in alphabetical order to the line name, for example 92ER2_1(a). The metadata header file appended to each line or line segment was created in Adobe Illustrator CS2. These header-merged images were then converted to grayscale, flattened, and saved as TIFFs with lossless (LZW) image compression. To facilitate easy viewing or printing of the scanned profiles on any computing platform using Web browser software, TIFF images were scaled to 25% (with constrained proportions and bicubic resampling) in Photoshop and saved as GIF images.
The uncompressed TIFF image files of the whole survey line or line segment (if greater than 30,000 pixels) are stored in the ORIGINALS folder as .zip files. Compressed line images with headers attached are stored in the PRINTABLE folder in both TIFF and GIF formats. Header files, in Adobe Illustrator format, can be found in the HEADERS folder.
Trackline maps and navigation files can be found on the Navigation page. The navigation fixes from both the GPS and LORAN-C systems are numbered by trackline and correspond to identical hand-numbered vertical event marks on the scanned profiles. A detailed description of the navigation acquisition system (1,445-KB PDF) has been included as a PDF file. Scanned images of the available handwritten cruise logbooks are provided as PDF files. Refer to the Acronyms page for expansions of acronyms and abbreviations used in this report. Formal FGDC metadata is also included and can be viewed on the Metadata page. The GIS page contains links to the documents and shapefiles used to create the trackline maps provided in this report.
NOTE: Examination of the data, after the cruise, showed that the navigation record for 92ER4 ended on 20 August, 1992, at 17:05Z during survey line 19; no navigation exists for the last 10 min of 92ER4_19(a) or any portion of 92ER4_19(b), 92ER4_20, and 92ER4_21. A mix of GMT and local time (GMT - 5 hours) was used throughout the dataset.
This disc contains a readme (21-KB .doc file) document, which provides a brief description of the report; GIS files, and all the Hypertext Markup Language (HTML) files, folders, and images used to produce the Web pages included in this report. The Contents page is a diagram of the location of all files and folders contained on this disc and provides links to these files and folders.
To access the information contained on this disc, use a Web browser to open the file index.html. This report is divided into seven sections: Acronyms, Contents, Navigation Data and Maps, Seismic Profiles, Field Activity Logs, Metadata, and GIS. Links at the top and bottom of each page provide access to these sections. This report contains links to the USGS and collaborators or other resources that are accessible only if access to the Internet is available while viewing these documents.
Funding and (or) support for the MASH data rescue project were provided by the USGS and the Minerals Management Service (MMS). Survey personnel included Jack Kindinger, Jack Moody, and Conrad Tome. This document was improved by the reviews of Chandra Dreher (Jacobs Technology Inc.) and Shawn Dadisman (USGS) at the FISC-CWST in St. Petersburg, FL.
Any additional data or information relevant to the 92ER2 or 92ER4 surveys would be appreciated. Please refer to the Metadata section for contact information.

![]() U.S. Department of the Interior |
U.S. Geological Survey
U.S. Department of the Interior |
U.S. Geological Survey
URL: https://pubsdata.usgs.gov/pubs/ds/370/index.html
Page Contact Information: Publishing Services
Page Last Modified: Monday, 28-Nov-2016 13:31:10 EST
