U.S. Geological Survey Data Series 477
Click once to open image in new window or tab, then click on opened image to zoom in.
Documentation pertaining to the Data Series is provided below. The Data page shows the location of all files and folders contained on this disc and provides links to these files and folders.
To access the information contained on this disc, use a Web browser to open the file index.html. This report is divided into two sections: Report and Data. Links at the top of each page provide access to these sections. This report contains links to the USGS and collaborators or other resources that are only accessible if access to the Internet is available while viewing these documents. Note: The only supported Web browsers that properly display all features of the interactive profiles are Internet Explorer 6 for Windows and Firefox 1.5 for all platforms
This series of raster data is a U.S. Geological Survey (USGS) Data Series release from the Florida Shelf Habitat Project (FLaSH). This disc contains two raster images in Environmental Systems Research Institute, Inc. (ESRI) raster grid format, jpeg image format, and Geo-referenced Tagged Image File Format (GeoTIFF). Data is also provided in non-image ASCII format. Rugosity grids at two resolutions (250 m and 1000 m) were generated for West Florida shelf waters to 250 m using a custom algorithm that follows the methods of Valentine and others (2004). The Methods portion of this document describes the specific steps used to generate the raster images.
Rugosity, also referred to as roughness, ruggedness, or the surface-area ratio (Riley and others, 1999; Wilson and others, 2007), is a visual and quantitative measurement of terrain complexity, a common variable in ecological habitat studies. The rugosity of an area can affect biota by influencing habitat, providing shelter from elements, determining the quantity and type of living space, influencing the type and quantity of flora, affecting predator-prey relationships by providing cover and concealment, and, as an expression of vertical relief, can influence local environmental conditions such as temperature and moisture. In the marine environment rugosity can furthermore influence current flow rate and direction, increase the residence time of water in an area through eddying and current deflection, influence local water conditions such as chemistry, turbidity, and temperature, and influence the rate and nature of sedimentary deposition.
State-of-the-art computer-mapping techniques and data-processing tools were used to develop shelf-wide raster and vector data layers. Florida Shelf Habitat (FLaSH) Mapping Project (http://coastal.er.usgs.gov/flash) endeavors to locate available data, identify data gaps, synthesize existing information, and expand our understanding of geologic processes in our dynamic coastal and marine systems.The techniques described were used to create Geographic Information System (GIS) data files for end-users. Two rugosity grids were created from USGS FLaSH bathymetric data using ArcMap, part of ArcGIS by ESRI. The FLaSH data used to generate these grids are freely available from the USGS (Robbins and others, 2007). The techniques described were used to create raster rugosity grids at two resolutions. The rugosity grids are provided for end-users as images (jpeg), georeferenced images (GeoTIFF), geographic information system (GIS) data files, and ASCII format text files.
ArcMap is a general-purpose mapping system typically used for map creation and geographic analysis. Within the ArcMap application, a raster surface model is generated in the form of a rectilinear grid, a two-dimensional array of depth (z) values. The ArcMap raster grid is used for producing contour lines, profile maps, calculating volumetric data, and for grid-to-grid comparison. Raster grids are particularly well suited for the display of values that vary over a continuous range, including rainfall, temperature, elevation, and rugosity.
The algorithm used to generate the rugosity grid is a custom ArcObject function that incorporates a model and algorithm described by Valentine and others (2004). This report describes the preliminary process of gridding Florida FLaSH bathymetric data at desired resolutions and the method used to generate a rugosity grid from the bathymetric data.
Previously published FLaSH point data (Robbins and others, 2007), consisting of bathymetric data containing a geographic coordinate (x, y) and a depth value (z) were loaded into ArcGIS. Bathmetric point data were interpolated at 250 m and 1000 m to generate two new bathymetric grids using the methods described in Robbins and others, 2007.
Previously published Florida Shelf Habitat (FLaSH) bathmetric point data (Robbins and others, 2007), consisting of bathymetric data containing a geographic coordinate (x, y) and a depth value (z) were loaded into ArcMap. These bathymetric points were interpolated into two bathymetric raster grids, two-dimensional arrays of cells, using the inverse distance-weighted interpolation method with a variable search radius incorporating the nearest six points for each cell. The two bathymetric raster grids have outer grid dimensions at multiples of 250 m and 1000 m. Rugosity grids were calculated from the new 250 m and 1000 m bathymetric grids using a custom script within ArcMap, a component of ArcGIS.
Rugosity is calculated by computing the average elevation change between a grid cell (0,0) and the eight neighboring grid cells, according to the algorithm described by Riley and others (1999), as modified by Valentine and others (2004).
Rugosity = ( | z(-1,1) - z(0,0) | + | z(0,1) - z(0,0) | + | z(1,1) - z(0,0) | + | z(-1,0) - z(0,0) | + | z(1,0) - z(0,0) | + | z(1,-1) - z(0,0) | + | z(0,-1) - z(0,0) | + | z(1,-1) - z(0,0) | ) / 8
, where z is the elevation in meters of a cell given a configuration of eight cells around a central cell (0,0):
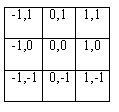
The rugosity value in this report represents the mean change, in meters, between a central cell and the eight surrounding cells. This value is represented in the legend with the unit m/cell. As an example, a cell cluster consisting of:

with 1000 m grid nodes would produce a rugosity value of 1.25 m/1000 m ([| 4 - 4 | + | 3 4 | + | 2 - 4 | + | 3 - 4 | + | 3 - 4 | + | 2 - 4 | + | 3 - 4 | + | 2 - 4 |] / 8) for the central (0,0) cell.
The resulting rugosity grids contain some error in the form of data artifacts and aliasing, particularly in regions with low point data densities. This is a function of the quality of the underlying bathymetric grid. Errors typically manifest as long linear or smooth-curved features not typically found in nature. The amount of visible error increases with the resolution; hence, the 250 m grid shows more error than the 1000 m grid.
Riley, S.J., DeGloria, S.D., and Elliot, R., 1999, A terrain ruggedness index that quantifies topographic heterogeneity: Intermountain Journal of Sciences, v. 5, no. 1-4, p. 23-27.
Robbins, L.L., Hansen, M.E., Raabe, E.A., Knorr, P.O., and Browne, J., 2007, Open File-Report 2007-1397: Cartographic Production for the Florida Shelf Habitat (FLaSH) Map Study: Generation of Surface Grids, Contours, and KMZ files, in Survey, U.S.G.: Reston, U.S. Department of the Interior, v. 2007, no. 1397.
Valentine, P.C., Fuller, S.J., and Scully, L.A., 2004, Terrain ruggedness analysis and distribution of boulder ridges and bedrock outcrops in the Stellwagen Bank National Marine Sanctuary regionseabed ruggedness.
Wilson, M.F.J., O'Connell, B., Brown, C., Guinan, J.C., and Grehan, A.J., 2007, Multiscale Terrain Analysis of Multibeam Bathymetry Data for Habitat Mapping on the Continental Slope: Marine Geodesy, v. 30, no. 1-2, p. 3-35.
This disc is readable on any computing platform that has standard DVD driver software installed. The minimum software requirements are a Web browser, Adobe Reader, and a text editor. If you cannot fully access the information on this page, please contact USGS Information Services at infoservices@usgs.gov or 1-888-ASK-USGS. Note: The only supported Web browsers that properly display all features of the interactive profiles are Internet Explorer 6 for Windows and Firefox 1.5 for all platforms.
Links to the map documents and shapefiles used to create the maps provided in this report can be found on the Data page. Map documents were created with ESRI ArcGIS 9.2 software. The shapefiles provided may also be viewed using other versions of ArcView, ArcGIS, or the freeware ArcGIS Explorer application.
This DVD publication was prepared by an agency of the United States Government. Neither the United States Government nor any agency thereof nor any of their employees makes any warranty, expressed or implied, or assumes any legal liability or responsibility for the accuracy, completeness, or usefulness of any information, apparatus, product, or process disclosed in this report or represents that its use would not infringe privately owned rights. Reference therein to any specific commercial product, process, or service by trade name, trademark, manufacturer, or otherwise does not constitute or imply its endorsement, recommendation, or favoring by the United States Government or any agency thereof.
Although all data and software published on this disc have been used by the USGS, no warranty, expressed or implied, is made by the USGS as to the accuracy of the data and related materials and (or) the functioning of the software. The act of distribution shall not constitute any such warranty, and no responsibility is assumed by the USGS in the use of these data, software, or related materials.
For further information about this project, contact Paul O. Knorr at the Florida Shelf Habitat Mapping Project, Coastal and Marine Geology Program, USGS, St. Petersburg, FL.
U.S. Department of the Interior
U.S. Geological Survey
Florida Integrated Science Center - St. Petersburg
Publications are available from USGS Information Services, Box 25286, Federal Center, Denver, CO 80225-0046 (telephone 1-888-ASK-USGS; e-mail: infoservices@usgs.gov).
Funding for this study was provided by the USGS Coastal and Marine Geology Program.

![]() U.S. Department of the Interior |
U.S. Geological Survey
U.S. Department of the Interior |
U.S. Geological Survey
URL: http://
pubsdata.usgs.gov
/pubs/ds/477/index.html
Page Contact Information: USGS Publications Team
Page Last Modified: Monday, 28-Nov-2016 15:15:34 EST