 |
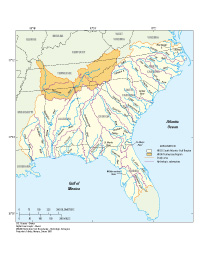
Figure 1. Locations of the South Atlantic–Gulf and Tennessee Hydrologic Regions in the Southeastern United States. |
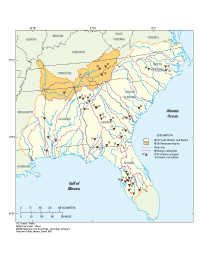 |
Figure 2. Locations of 44 water-quality monitoring sites for which chemical constituent and physical property data were retrieved from the U.S. Geological Survey National Water Information System database and used in the temporal trend analyses. |
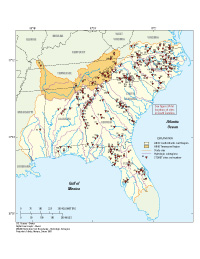 |
Figure 3. Locations of 290 water-quality monitoring sites for which selected chemical constituent data were retrieved from the U.S. Environmental Protection Agency Storage and Retrieval database and used in the temporal trend analyses. |
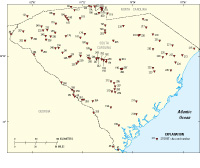 |
Figure 3A. Locations of the water-quality monitoring sites in South Carolina for which selected chemical constituent data were retrieved from the U.S. Environmental Protection Agency Storage and Retrieval database and used in the temporal trend analyses. |
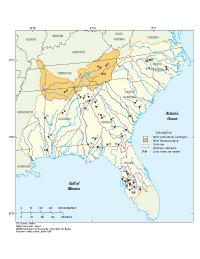 |
Figure 4. Locations of 48 water-quality monitoring sites for which in-stream nutrient load data were retrieved from the U.S. Geological Survey National Water Information System and analyzed. |


