U.S. Geological Survey Data Series 488
Data Used in Analyses of Trends, and Nutrient and Suspended-Sediment Loads for Streams in the Southeastern United States, 1973–2005
|
Trend Analysis and Load-Estimation MethodsThe software programs used for trend analysis and load estimation offer many user-defined options, and results can vary depending on the selections made. Therefore, it is important to describe the choices and options selected for the analyses in this study. The following sections present the selections used to produce the trend and load results provided later in this report. Detection of TrendsStatistical tests for trends in water quality over time were performed by using S-ESTREND (version 1.1), which is a USGS “plug-in” version of ESTREND in S-PLUS (version 6.1), a statistical software package. The S-PLUS version of ESTREND allows the user to perform trend analyses for multiple sites and constituents. Documentation is contained in the publicly available USGS library for S-PLUS for Microsoft® Windows, release 2.1 (Slack and others, 2003). ESTREND software can be downloaded from the USGS Web site http://water.usgs.gov/software/library.html (accessed December 23, 2009). The default settings were accepted in all instances throughout the trend-test procedure. Default data requirements included a minimum of 50 observations during a minimum of 5 years. The following steps and procedures were selected:
Given these criteria, the subsequent step, Select Best Season was allowed.
In all instances where flow adjustment was appropriate, model number 13 (LOESS) was selected. The final step before performing the trend test for a constituent or property requires the choice of one of three trend-test methods—the Seasonal Kendall test for uncensored data, the Seasonal Kendall test for censored data, or Tobit regression model. Choices were made on the basis of the following criteria:
Estimation of Nutrient LoadsAnnual in-stream load estimates from 1973 to 2005 of unfiltered nitrogen [00600], filtered ammonia [00608], ammonia plus organic nitrogen [00625], filtered nitrite plus nitrate [00631], unfiltered phosphorus [00665], filtered orthophosphate [00671], and suspended sediment [80154] were calculated by using the statistical program LOADEST (Runkel and others, 2004). The specific software used in this study was S-LOADEST, which is a USGS “plug-in” version of LOADEST in S-PLUS (version 6.1). Documentation is contained in the publicly available USGS library for S-PLUS for Microsoft® Windows, release 2.1 (Slack and others, 2003). S-LOADEST software can be downloaded from the USGS Web site http://water.usgs.gov/software/library.html (accessed December 23, 2009). The load estimates were calculated by using a five-variable log-linear regression model (Cohn and others, 1989; Gilroy and others, 1990; Cohn and others, 1992): ln L = a0 + a1 ln Q + a2 t +a3sin (2 t) + a4cos (2 t) + e, (1)
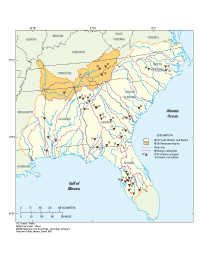
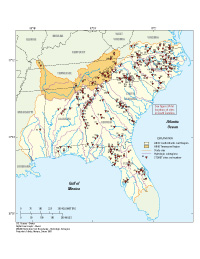
The discharge term (a1ln Q) in the model addresses variability in concentration resulting from discharge variability. The time term (a2t) adjusts for variability resulting from a linear time trend in concentration, and the sine and cosine terms adjust for seasonal variability in concentration. Bias that was generated when the load was transformed from log to linear units was corrected by using the minimum variance unbiased estimator (MVUE) correction (Bradu and Mundlak, 1970). Censored data were adjusted statistically by using the adjusted maximum likelihood estimator (AMLE; Cohn, 1988). Datasets Used for Trend Analysis and Load EstimationWater-quality data were retrieved from the USGS NWIS and the USEPA STORET for WYs 1973–2005 for trend analysis and load estimation. Available data for the parameters listed in table 1 from the USGS NWIS database are organized by state in table 3 and accessible by clicking on the desired table number. Available data for total nitrogen and total phosphorus from the USEPA STORET database and a value for daily mean streamflow are organized by state in table 4 and can be accessed by clicking on the desired table number. The continuous streamflow files used in load estimation are listed in table 5. Trends in Water QualityTrend analyses were performed on property and chemical constituent data retrieved from the USGS NWIS and the USEPA STORET databases. Water-quality data for nutrients, suspended sediment, and major ions in streams for the period 1973–2005 were included in the trend analyses for the NWIS sites, whereas the trend analyses of the STORET data were limited to total nitrogen and total phosphorus concentrations. The following sections present results of the trend analyses performed on the data from the water-quality monitoring sites. U.S. Geological Survey National Water Information SystemTrend analyses were conducted on physical property and chemical constituent data from the NWIS database and included many properties and constituents (table 1) at multiple sites (fig. 2; table 6) and covered multiple time periods. Trend tests were performed on available data for multiple time periods within the POR, including WYs 1993–2003, 1993–2004, and 1993–2005, and for the longest period allowed by data availability. Results for all constituents analyzed are given in table 7 and presented individually in table 8. U.S. Environmental Protection Agency Storage and Retrieval DatabaseConstituents retrieved from the USEPA STORET database include unfiltered phosphorus [00665] and unfiltered nitrogen [00600] concentrations from 290 sites (fig. 3; table 9). Trend tests were performed on available data for WYs 1975–1985, 1985–1995, 1993–2004, and 1975–2004. Results for each constituent analyzed are provided in table 10. Time Series of Basin CharacteristicsEstimates at selected annual time-series steps were compiled for basin watershed characteristics that influence the transport of water-quality constituents. These time series were compiled to support subsequent investigations of the relation between annual variations in water quality and annual variations in basin characteristics. The basin characteristics derived for each basin are defined in appendix table A1, and the data are presented in table 11.
|

![]() U.S. Department of the Interior |
U.S. Geological Survey
U.S. Department of the Interior |
U.S. Geological Survey
URL: http://
pubsdata.usgs.gov
/pubs/ds/488/trends.html
Page Contact Information: USGS Publications Team
Page Last Modified: Monday, 28-Nov-2016 15:11:33 EST