U.S. Geological Survey Data Series 514
Swath Bathymetry Surveys of the Monterey Bay Area from Point Año Nuevo to Moss Landing, San Mateo, Santa Cruz, and Monterey Counties, CaliforniaFigures
Figure 1
Map of the survey area between Point Año Nuevo and Moss Landing, California. Survey planning blocks are shown with RTK base stations and repeater. Full-size Image (136 Kb) 
Figure 2
Data Processing workflow showing data acquisition and processing hardware and software along with process steps. Full-size Image (92 Kb) 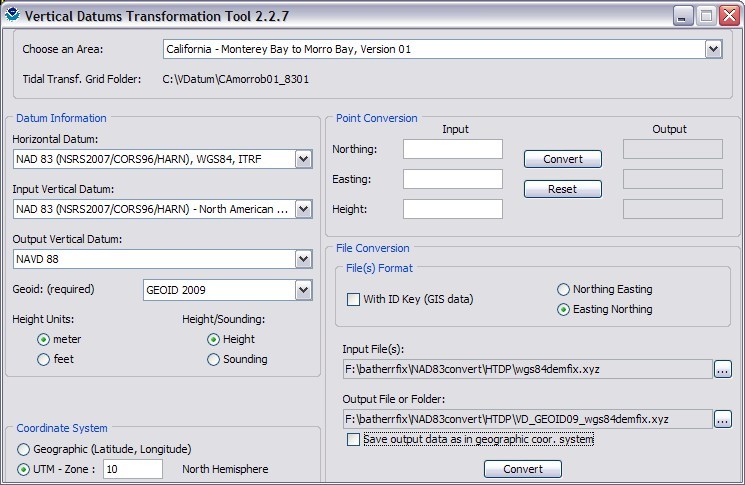
Figure 3
VDatum software dialog window showing settings used to transform vertical coordinates from NAD83(CORS96) to NAVD88. Full-size Image (82 Kb) 
Figure 4
Hillshaded bathymetry image of the Monterey Bay, California, project area. Full-size Image (286 Kb) 
Figure 5
Gain-normalized backscatter amplitude image for the Monterey Bay, California, project area. Full-size Image (333 Kb) 
Figure 6
Plot of depth-normalized 2 sigma standard deviation for the Monterey Bay, California, project area. Full-size Image (410 Kb) 
Figure 7
Plot of depth-normalized 2-sigma standard deviation values in an area with rocky nearshore topography. The high roughness leads to higher standard deviation values because elevation varies within the 2-m grid cells. Full-size Image (758 Kb) 
Figure 8
Plot of depth-normalized 2-sigma standard deviation values at the outer survey boundary between blocks G and H (figure 1). Values are lower because of deeper water, but note how the higher values fall along rock ledges at the canyon edge. Higher values west of the canyon are due to track spacing that is approaching the limits of the sonar. Full-size Image (726 Kb) 
Figure 9
Plot of depth-normalized 2-sigma standard deviation values near Moss Landing. Higher values along the steep slopes of the canyon wall are due to elevation differences within a 2-m grid cell. Higher values near shore are in shallow water. Full-size Image (664 Kb) 
Figure 10
Depth-normalized 2-sigma standard deviation values across several survey lines relative to tie line. Note the "ridges" as you approach nadir. These appear to be artifacts of the SWATH mapping sonar. Full-size Image (217 Kb) 
Figure 11
Plot of depth-normalized 2 sigma standard deviation values for all tie-line profiles. Higher standard deviation values approaching shore are due primarily to high relief in the nearshore rocky areas (see figure 7). Full-size Image (150 Kb) 
Figure 12
Plot comparing Monterey Bay, California, project data with IHO Survey Standards. Total vertical uncertainty generally was within the limits specified by IHO Order 1 or Special Order surveys. Exceptions generally follow the same pattern as for standard deviations. Full-size Image (425 Kb) 
Figure 13
Plot comparing survey data near Point Año Nuevo, California, with IHO Survey Standards. Note that the areas where total vertical uncertainty exceeds IHO Order 1 specifications primarily are over areas with surface relief that exceeds the grid-cell resolution. Full-size Image (820 Kb) 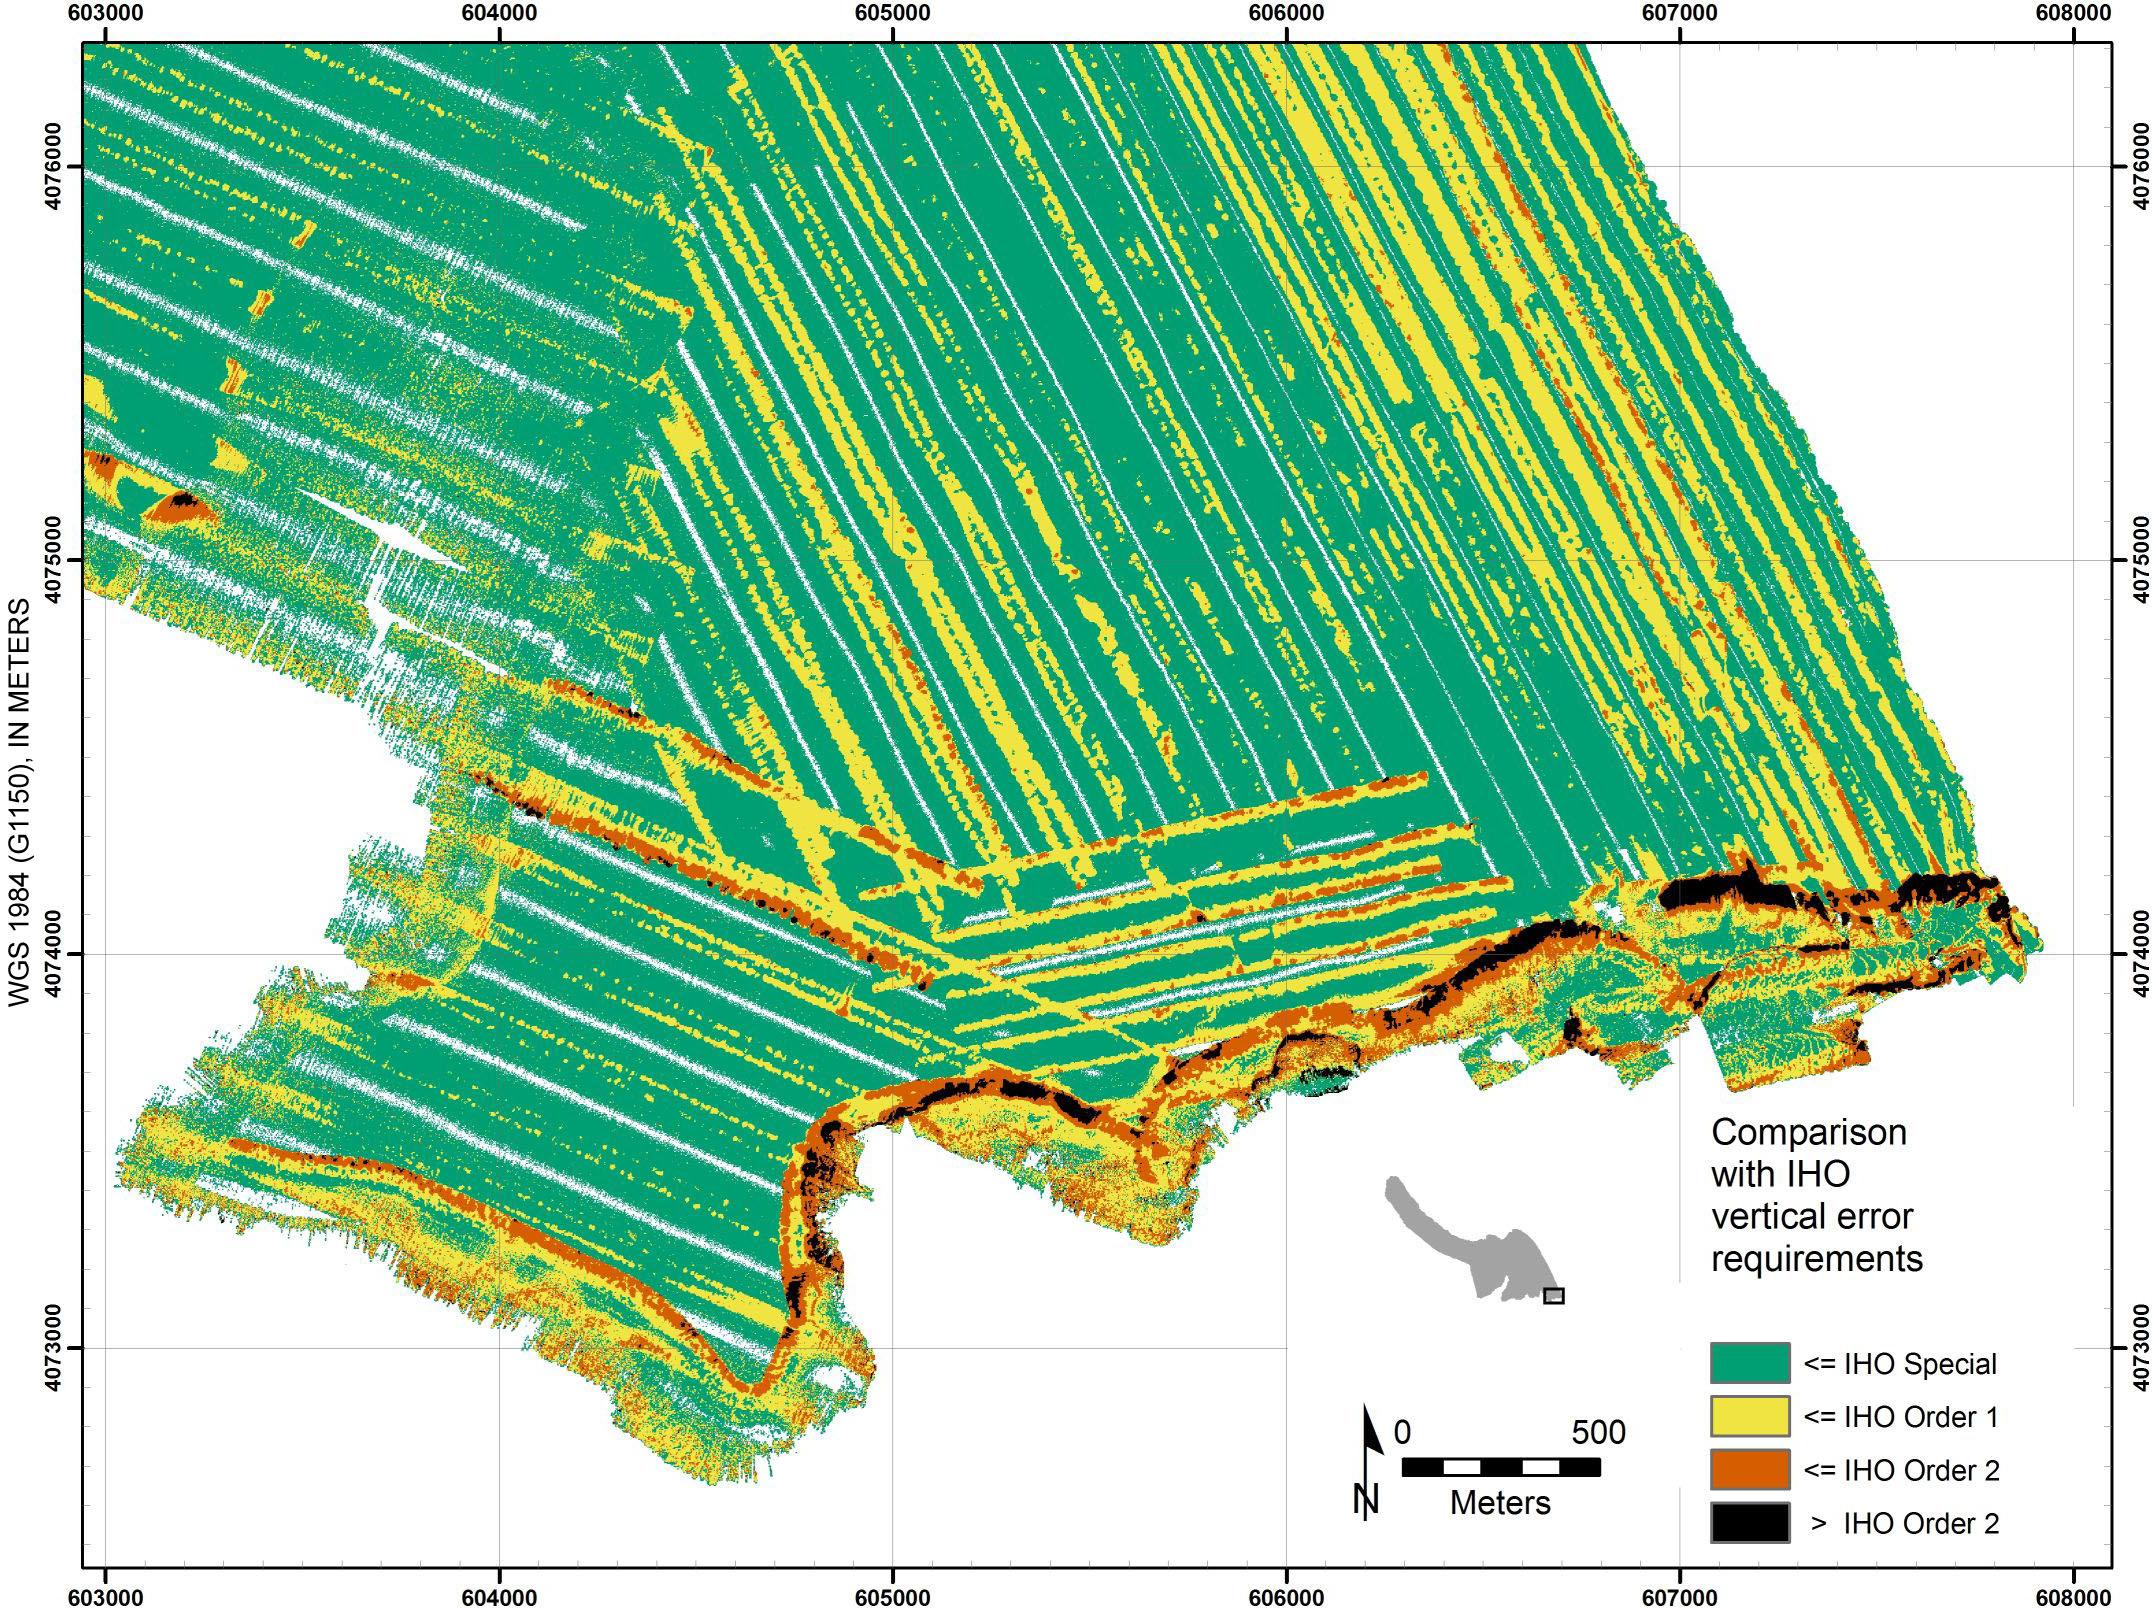
Figure 14
Plot comparing survey data near the head of Monterey Canyon with IHO Survey Standards. Note that most of the areas where total vertical uncertainty exceeds IHO Order 1 specifications are on the steeply sloping canyon walls. A few lines near shore exceeding IHO standards may not have been trimmed properly to minimize noise at the outer edge of the beam. Full-size Image (789 Kb) |
|
|
For more information, contact David Finlayson. |

![]() U.S. Department of the
Interior | U.S. Geological
Survey
U.S. Department of the
Interior | U.S. Geological
Survey
URL: https://pubs.usgs.gov/ds/514/figures.html
Page Contact Information: Michael Diggles
Page Last Modified: July 13, 2010 (mfd)
