Data Series 523, Version 3.0
1 U.S. Geological Survey, Truckee, Calif.
2 U.S. Geological Survey, Menlo Park, Calif.
3 U.S. Geological Survey, Sacramento, Calif.
* Retired.
U.S. Department of the Interior
SALLY JEWELL, Secretary
U.S. Geological Survey
Suzette M. Kimball, Director
Introduction
The 30-by-20-km Long Valley Caldera (LVC) in eastern California (fig.1) formed at 0.76 Ma in a cataclysmic eruption that resulted in the deposition of 600 km³ of Bishop Tuff outside the caldera rim (Bailey, 1989). By approximately 0.6 Ma, uplift of the central part of the caldera floor and eruption of rhyolitic lava formed the resurgent dome. The most recent eruptive activity in the area occurred approximately 600 yr ago along the Mono-Inyo craters volcanic chain (Bailey, 2004; Hildreth, 2004). LVC hosts an active hydrothermal system that includes hot springs, fumaroles, mineral deposits, and an active geothermal well field and power plant at Casa Diablo along the southwestern boundary of the resurgent dome (Sorey and Lewis, 1976; Sorey and others, 1978; Sorey and others, 1991). Electric power generation began in 1985 with about 10 Mwe net capacity and was expanded to about 40 Mwe (net) in 1991 (Campbell, 2000; Suemnicht and others, 2007). Plans for further expansion are focused mainly on targets in the caldera’s western moat (Sass and Priest, 2002) where the most recent volcanic activity has occurred (Hildreth, 2004).
LVC has been the site of extensive research on geothermal resources and volcanic hazards (Bailey and others, 1976; Muffler and Williams, 1976; Miller and others, 1982; Hill and others 2002). The first geothermal exploratory drilling was done in the shallow (< 200 m deep) hydrothermal system at Casa Diablo in the 1960’s (McNitt, 1963). Many more boreholes were drilled throughout the caldera in the 1970’s and 1980’s by private industry for geothermal exploration and by the U.S. Geological Survey (USGS) and Sandia National Laboratory for volcanic and geothermal research and exploration. Temperature logs were obtained in some of these wells during or immediately following drilling, before thermal equilibration was complete. Most of the temperature logs, however, were obtained weeks, months, or years after well completion and are representative of dynamic thermal equilibrium.
The maximum reservoir temperature for LVC is estimated to be about 220°C on the basis of chemical geothermometers (Fournier and Truesdell, 1973) using analytical results from water samples collected from a large number of wells and springs across the caldera and around its periphery (Lewis, 1974; Mariner and Wiley, 1976; Farrar and others, 1985, 1987, 1989; White and Peterson, 1991). The deepest well in LVC (~3 km) is the Long Valley Exploratory Well (LVEW) drilled in the 1990’s with funding from the U.S. Department of Energy to investigate the potential for near-magmatic-temperature energy extraction and the occurrence of magma under the central part of the resurgent dome (Finger and Eichelberger, 1990; Finger and Jacobsen, 1999; Sackett and others, 1999). However, temperatures beneath the resurgent dome have proved disappointingly low and in LVEW reach a maximum of only 102°C in a long isothermal section (2,100 to 3,000 m) in Mesozoic basement rocks (Farrar and others, 2003; Pribnow and others, 2003; Hurwitz and others, 2010). Temperature data from well logs and geothermometry reveal that the highest temperatures in LVC are beneath the western moat. The hottest temperatures measured in LVC exceed 200° C in two wells (44-16 and RDO-8) located in the western moat. Well 44-16 was drilled through the entire thickness of post-caldera volcanic fill and bottomed in Mesozoic basement. Well RDO-8 was drilled through post-caldera volcanic rocks and 305 m into the Bishop Tuff (Wollenberg and others, 1986). Temperatures in the hydrothermal system decrease toward the east by processes of conduction and dilution from cold groundwater recharge that occurs mostly around the caldera margin and beneath the resurgent dome. Reservoir temperatures at Casa Diablo (fig.1) are about 170°C (for example, MBP-3 and Mammoth-1), decreasing to about 100°C in wells near Hot Creek Gorge (for example, MW-4 and CH-10B), and are generally less than 50°C in thermal springs near Lake Crowley (Lewis, 1974; Farrar and others, 1985).
The decrease in reservoir temperature from west to east in LVC is mirrored by a decrease in hydraulic head from the west moat toward Lake Crowley (Farrar and others, 2003). The topography of the caldera floor, although complicated by postcaldera volcanic activity, glacial processes, and fluvial erosion, slopes gradually down from 2,400 m to about 2,070 m at Lake Crowley. The higher head in the west moat and easterly hydraulic gradient result from the higher topography and greater recharge supplied to the hydrothermal system in the west moat than elsewhere in the caldera. The nonthermal and hydrothermal aquifers are recharged by the annual melting of the snowpack that accumulates in the mountains of the Sierra Nevada bordering the caldera on the south and west sides.
The temperature and hydraulic head data and the geologic history of LVC are the basis for a conceptual model of the hydrothermal system in which recharge occurs mostly near the mountain front around the western and southern caldera boundary, where steeply dipping normal faults allow water to circulate deeply (~3 km) and absorb heat conductively from crystallizing Quaternary intrusions associated with the Mono-Inyo volcanic system. The less dense heated water moves up convectively along faults that intersect permeable zones of unwelded or fractured Bishop Tuff and Early Rhyolite and then flows eastward along the hydraulic gradient to natural discharge points mostly in the south and east moats of the caldera. Because the principal upflow zone resides in the west moat and more nearly horizontal flow prevails across the eastern two-thirds of the caldera, many temperature profiles in wells show temperature maxima at relatively shallow depths, with temperature reversals below. The temperature maxima define the extent of the easily exploitable part of the hydrothermal system but are located in the cooler outflow region, several kilometers east of the main heat source.
The Database
The database contains temperature logs obtained by private industry, the U.S. Geological Survey, and Sandia National Laboratory. Logging methods and equipment have varied between years and companies or agencies. Because of differences in the equipment or methods, the quality, resolution, and precision of the data are not the same for all the logs. For most of the logs made by private companies the precision is not known. USGS has produced temperature data using portable gear and also by geophysical logging trucks. The USGS portable temperature-measuring gear uses a hand-cranked cable reel with four-conductor wire and calibrated thermistor or platinum resistance sensors that typically provide an accuracy of 0.1°C and precision of .01°C (Sass and others, 1971). The “stop and go” method is used with the portable gear, which involves lowering the sensor on cable over a calibrated counter wheel mounted on the well head to the selected depths and waiting about 1-2 minutes until the resistance reaches a stable value, from which a temperature is calculated. Temperature data collected by the logging trucks were electronically recorded, generally while the sensor was lowered at a constant speed over the desired depth range. The USGS logging trucks and equipment that have been used from the 1970s to recently have included different configurations, but the accuracy and precision have remained better than 0.1°C and 0.01°C, respectively.
The temperature data in this report are saved in Excel spreadsheet files (*.xls). Each data file contains a header that indicates the name of the well, logging data, method used, and the name of the logger. The file then contains three columns:
Depth (ft) Depth (m) Temperature (°C)
To download a temperature log from a well in the database, click on a well symbol on the map below or view a list of the wells
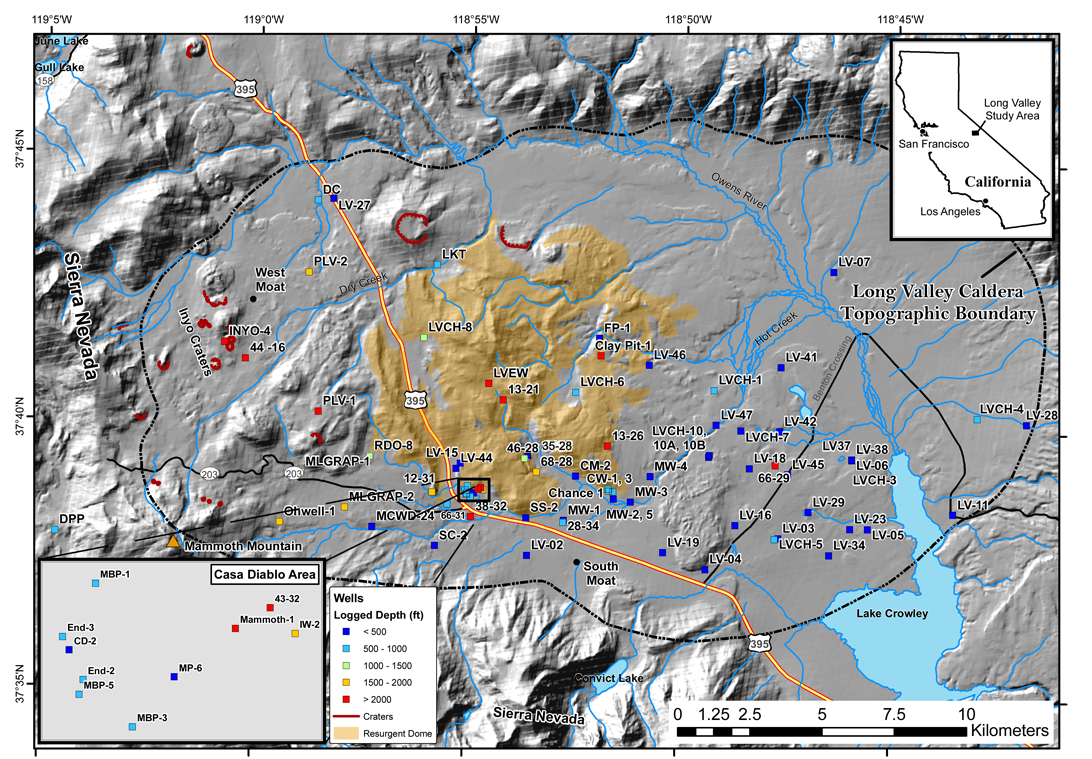
Figure 1. Map showing locations of wells with temperature log data in the Long Valley Caldera and vicinity.
Abbreviations Used in this Report
Ma: Millions of years before present
Mwe: Megawatts electric power
Conversions Used in this Report
| Multiply | By | To Obtain |
| Centimeters (cm) | 0.3937 | Inches (in) |
| Kilometers (km) | 0.6214 | Miles (mi) |
| Meters (m) | 3.2808 | Feet (ft) |
| Feet (ft) | 0.3048 | Meters (m) |
Temperatures in degrees Celsius (°C) may be converted to degrees Fahrenheit (°F) as follows: F = C * 9/5 + 32
Google Earth file with well locations
References to non-U.S. Department of the Interior (DOI) products do not constitute an endorsement by the DOI. By viewing the Google Maps API on this web site the user agrees to these TERMS of Service set forth by Google.
References on heat flow studies in Long Valley Caldera
Acknowledgments
Michelle Sneed and Whitney Seymour are thanked for constructive reviews.
Suggested citation
Farrar, C., DeAngelo, J., Clor, L., Murphy, F., Williams, C., Grubb, F., and Hurwitz, S., 2010, Temperature data from wells in Long Valley Caldera, California (ver. 3.0, November 2016): U.S. Geological Survey Data Series 523, https://pubs.usgs.gov/ds/523/.
For additional information, contact:
NRP staff
Water Resources National Research Program
U.S. Geological Survey
345 Middlefield Road, MS-435
Menlo Park, CA 94025
National Research Program
This report is available only on the Web.

![]() U.S. Department of the Interior |
U.S. Geological Survey
U.S. Department of the Interior |
U.S. Geological Survey
URL: http://pubsdata.usgs.gov/pubs/ds/523/intro.htm
Page Contact Information: GS Pubs Web Contact
Page Last Modified: Tuesday, 13-Dec-2016 11:29:46 EST
