U.S. Geological Survey Data Series 675
The 2008-2009 bathymetric surveys were patterned after the System for Accurate Nearshore Depth Surveying (SANDS), a single beam acoustic (sounding) GPS-based hydrographic system developed by the USGS for shallow-water mapping (Hansen, 2008). SANDS differs from conventional bathymetric surveys in that it references bathymetric measurements to GPS rather than water depth. The objective of SANDS is to concurrently acquire GPS data sessions that yield a differentially corrected navigation file which is used to process high resolution bathymetric measurements. This requires a base station occupying a known benchmark on land (the base) and an equivalent GPS receiver on the survey vessel (rover) in which both receivers are simultaneously recording the positioning signal from the Navigation Signal Timing and Ranging (NAVSTAR) GPS satellite constellation (fig. 2). To keep differential position error as low as possible, the acquisition practices of SANDS adhere to guidelines. These include but are not limited to (1) occupying benchmarks rated as high vertical order for base position control. If such benchmarks are unavailable, more base occupation time is allotted to help ensure that the post-processed base position accuracy is centimeter-level or less, (2) the distance between the base and roving vessel is kept 20 km or less, (3) several crossing lines are surveyed at different times for quality control, and (4) all GPS receiver data are post-processed as opposed to using the real time kinematic (RTK) method. The processing segment of the SANDS component is twofold. The first step is post-processing the GPS sessions (rover to the base), which yields the differentially corrected navigation file. The second part of SANDS is a stand-alone program which first applies a GEOID model to the differential navigation and then geometrically corrects the depth data using time and boat motion. The output is high precision x,y,z data in orthometric height.
The single-beam data for 2008-2009 were collected and processed using SANDS. The 2008-2009 swath bathymetry was acquired using the Systems Engineering and Assessment Ltd. (SEA) SWATHplus-H 468 kHz Interferometric System. Differential navigation for the swath data was acquired and processed using SANDS methodolgy and threaded into SEA SWATHplus to produce bathymetric files. These processes are described in further detail on this page and continued on the Equipment and Processing page.
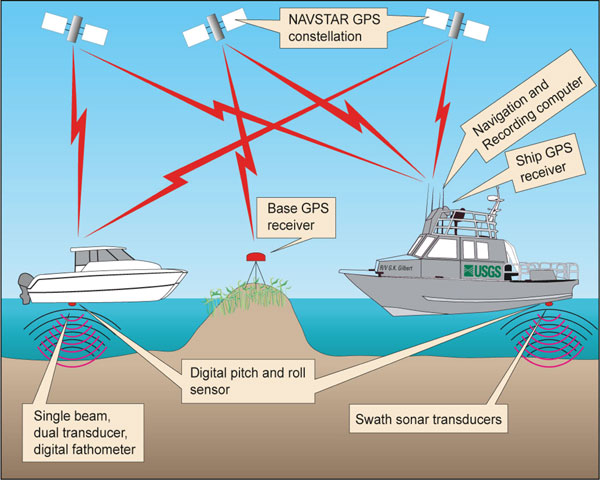
Figure 2. Diagram of SANDS data acquisition showing land-based GPS station (base) and ship-board receivers (rover). [larger version] |
Temporal changes in wind speed and direction and tidal set fluctuations influence the sea surface by pushing water into or out of a basin, causing water level to increase or decrease. If these conditions persist during a bathymetric survey they may introduce biased depth measurements that reflect the current conditions rather than represent the actual water depth under typical sea surface conditions.
Bathymetric measurements referenced to a Global Positioning System (GPS) provide a more accurate way of representing water depth. GPS is based upon the earth-centered coordinate system called the World Geodetic System of 1984 (WGS84) for horizontal positioning and vertical positioning. Earth-centered systems reference all points on the Earth's surface relative to a theoretical centroid of the Earth and are globally applicable. The most common modern horizontal datum in North America is the North American Datum of 1983 (NAD83), which is based upon the GRS80 ellipsoid. The precursor earth-centered ellipsoid to WGS84 was the Geodetic Reference System of 1980 (GRS80). For all survey techniques, there was not a direct conversion of horizontal positions to NAD83, as it is assumed WGS84 sounding positions are also relative within millimeters to GRS80/NAD83 (Schwarz, 1989; Hooijberg, 1997).
Vertical positions referenced to earth-centered systems are referred to as ellipsoid heights. Using earth-centered reference systems for the vertical component eliminates the need to reference bathymetric data to water levels (tide gages). This is a more accurate measurement because every processed data point has high precision x,y,z value that is not interpolated over time. For example, if GPS data and depth values are acquired every second, that gives an x,y,z value every second. A local tide gage may only record water level data every 15 minutes or hour. If these tide data are applied to a bathymetry survey, then all the bathymetry values recorded in between the water level record have to be interpolated.
A minor disadvantage to using an ellipsoid for vertical reference over mean sea level (MSL) is that conversion from standard formats such as North American Vertical Datum of 1929 (NAVD29) and North American Vertical Datum 1988 (NAVD88) to water-level based datums (for example, MSL, or mean lower low water (MLLW)) is a more involved process. Vertical difference estimates or numerical models must be utilized for the conversion and thus may introduce bias errors into the final elevation.
GPS receivers with internal data cards record the 12-channel full-carrier-phase positioning signals (L1/L2) from the satellites via the Thales choke-ring antenna (fig. 4). This GPS instrument combination is duplicated on the survey vessel (rover). The base receiver and the rover receiver record their positions concurrently at 1-second (s) recording intervals throughout the survey period. The differential navigation for the single-beam bathymetry and the swath bathymetry navigation were both collected in the same manner.
By eliminating the use of the water level datum, the reliability of the system shifts to the GPS antenna and its capability of recording quality data. Atmospheric conditions can degrade the signal from the NAVSTAR satellites, so efforts are taken to not survey during storms or heavy cloud cover. Percent Dilution of Position (PDOP) is a measure of the satellite signal strength. PDOP values can range from 1 to greater than 20 (the lower the value the better the GPS accuracy), and anything under 3 is considered excellent quality. When the PDOP value read 3 or higher, survey operations were suspended until the PDOP decreased.
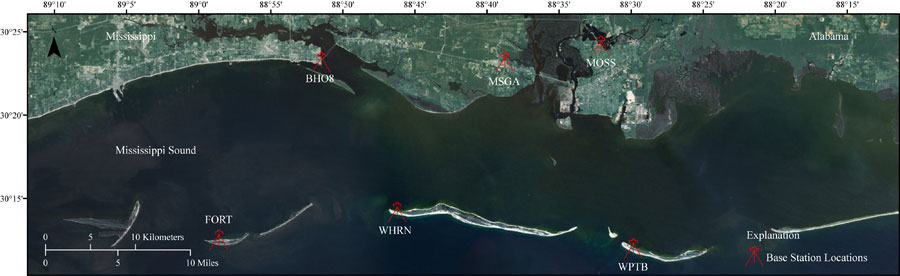
Figure 3. Map showing GPS base station locations for 2008-2009 survey. The site names and their affiliations are as follows: BH08 (NGS PID = BH0866), MSGA (NGS-CORS PID =DJ8941), MOSS (NGS PID = BH0314), FORT (NGS PID = BH1894 ), WHRN (USGS), and WPTB (USGS). [larger version] |
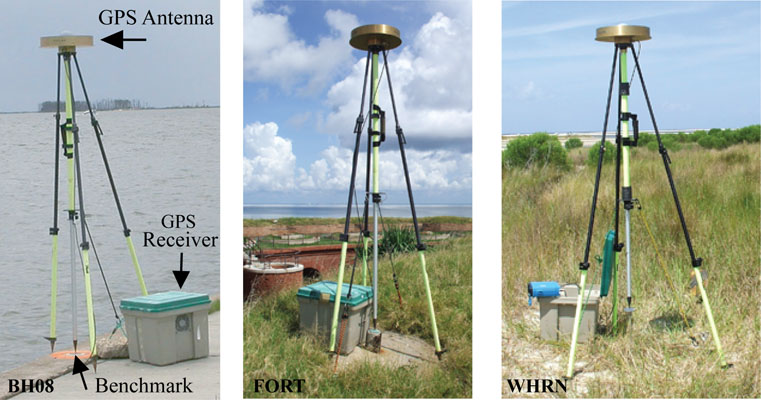
Figure 4. Some examples of the GPS base stations and their components. From left to right, BH08, located on the seawall in Biloxi; FORT, atop Fort Massachusetts on West Ship Island; and WHRN, on the western end of Horn Island. |
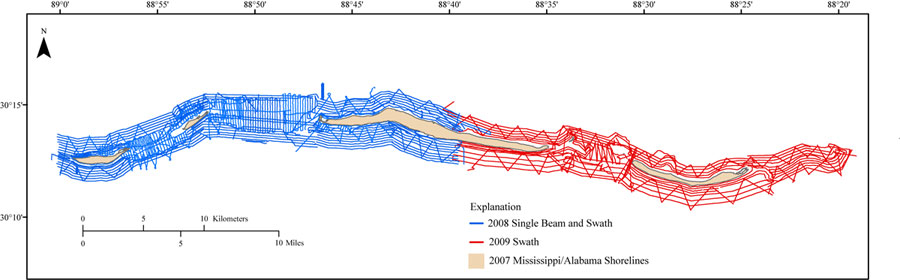
Figure 5. Trackline map showing single beam and swath survey coverage for the RV Survey Cat and the RV G.K. Gilbert for 2008 (blue) and 2009 (red). [larger version] |
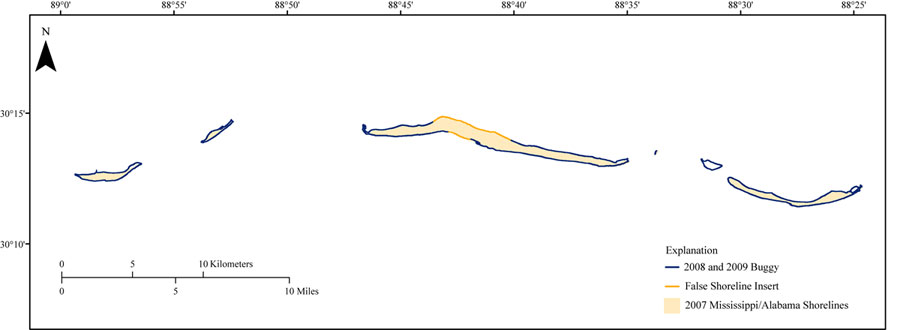
| Figure 6. Trackline map of shoreline survey coverage using the portable buggy. [larger version] |

![]() U.S. Department of the Interior |
U.S. Geological Survey
U.S. Department of the Interior |
U.S. Geological Survey
URL: http://pubsdata.usgs.gov/pubs/ds/675/html/position_nav.html
Page Contact Information: GS Pubs Web Contact
Page Last Modified: Monday, 28-Nov-2016 18:39:54 EST