U.S. Geological Survey Data Series 727
Nineteenth Century Topographic Charts
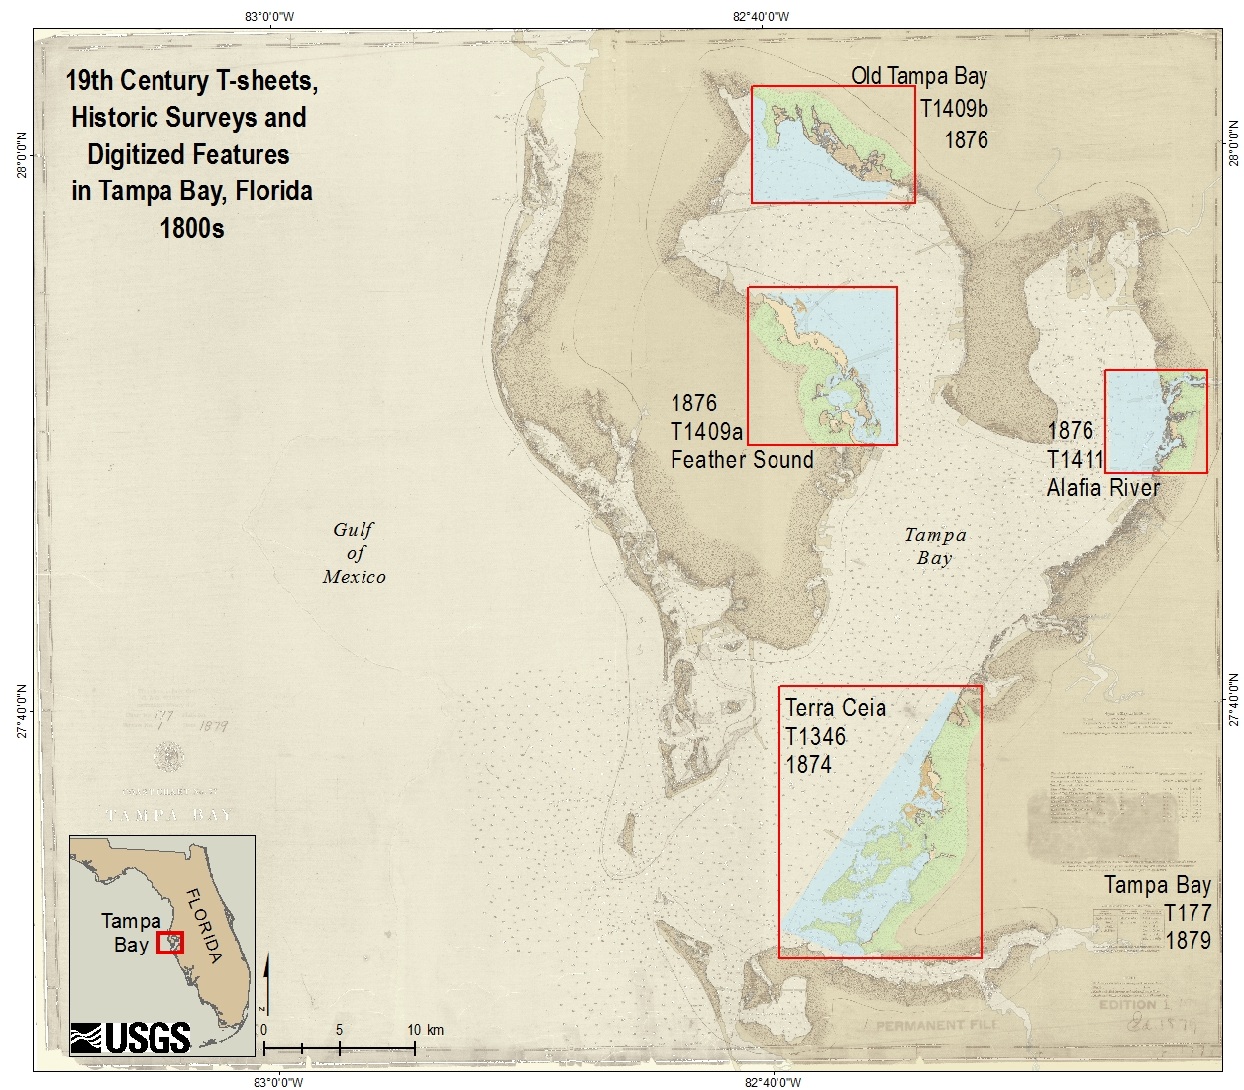
Scanned copies of four T-sheets (see Study Areas) surveyed between 1874 and 1876 were used for change analysis in Tampa Bay (table 1). Each T-sheet was georectified to modern features in a Geographic Information System (GIS). Georectification and digitization of the historic charts followed methods outlined previously (Raabe and others, 2004). Briefly, geographically distributed control points were selected using stable features, least prone to change, such as a rock promontory or an undeveloped embayment. A first- or second-order polynomial model was developed to “fit” each chart to a modern coordinate system, datum, and ellipsoid with an overall root mean square (RMS) error of 5 meters (m) or less. Each stage of the process was double-checked to ensure a “best” fit and to establish consistent and reliable interpretation of historic data.
Table 1. Tampa Bay, Florida study site, topographic chart name, year, record number, and map scale.
|
Study Site |
Topographic Chart |
Year |
Number |
Scale |
|---|---|---|---|---|
|
Terra Ceia |
Tampa Bay Palmasola Pt. to Piney Pt. |
1874 |
1346b |
1:20,000 |
|
Feather Sound |
Lower Sheet Old Tampa Bay |
1875 |
1409a |
1:20,000 |
|
Alafia River |
Hillsboro Bay Ballast Pt. to Mangrove Pt. |
1876 |
1411a |
1:20,000 |
|
Old Tampa Bay |
Upper Sheet Old Tampa Bay |
1875 |
1409b |
1:20,000 |
Map symbols were interpreted and digitized. Four historic landscape zones were derived from mid-19th-century coastal surveys or T-sheets: open marine water, terrestrial, intertidal mangrove, and intertidal non-mangrove (fig. 1). Intertidal wetlands depicted on T-sheets were separated into one of two categories: intertidal with mangrove and intertidal without mangrove. The mangrove category included areas mapped with mangrove symbols in the intertidal zone as individual tree symbols or groups, labeled as mangrove ‘flats’, or mapped as tidal marsh with scattered mangrove symbols. Intertidal areas lacking mangrove symbols were generally illustrated with the marsh symbol, but occasionally included flats or barrens, and were designated as non-mangrove intertidal for the purpose of this study. Topographic charts did not include species identification, so further map characterization by mangrove, marsh, or forest type was not feasible. Upland features such as pinewoods, scrub, or oak hammock were interpreted and digitized as terrestrial. Wetlands, ponds, and waterways within uplands, and lacking a connection to the bay, were interpreted as freshwater features and included in the terrestrial category. Open or navigable waters, such as creek and pond features with direct connection to the bay, were interpreted as marine or open water. Low water features, or obstructions to navigation, were included in the open water category. Results of the digitized features and comparison to modern were published in Raabe and others (2012).
Nineteenth Century Public Land Surveys
Public Land Surveys (PLS), intersecting the four study sites, were conducted between 1842 and 1858 (table 2). PLS, overseen by the General Land Office, were conducted to establish 1-mile Township and Range lines for Public Land sales in the 19th century. Notes for each section line included a land rating for various uses, bearing (witness) trees recorded at section corners and ½-mile markers, and stopping points recorded where change of land cover occurred or where wet areas were crossed or circumnavigated (fig. 2). Historic records of trees, vegetation, and land characteristics as supplied in the handwritten surveyor notes served as a secondary historic source to verify historic T-sheets. PLS data summaries and comparison with the T-sheet survey data are available in a separate publication (Raabe and others, 2012).
Table 2. Tampa Bay, Florida study site, intersecting Township and Range lines, and corresponding PLS survey years.
|
Study Site |
Township/Range |
PLS Survey Year(s) |
|---|---|---|
|
Terra Ceia |
32S/18E |
1846 |
| 33S/17E | 1843, 1844, 1846, 1858 | |
| 33S/18E | 1843, 1846 | |
| 34S/17E | 1843 | |
|
Feather Sound |
29S/16E |
1844 |
| 30S/16E | 1845 | |
| 30S/17E | 1848 | |
|
Alafia River |
30S/19E |
1842, 1843, 1852 |
| 31S/19E | 1843, 1847 | |
|
Old Tampa Bay |
28S/16E |
1844 |
| 28S/17E | 1844, 1852 | |
| 29S/17E | 1852 |
The USGS converted historic PLS measurements from links and chains to meters (link = 0.01 chain; chain = 20.1168 m). Survey stopping points (stoppoints.shp) were digitized along Township and Range lines and compiled in a GIS. Stopping points included terminology to describe entering and leaving hammock, scrub, ponds, creeks, sawgrass, prairie, marsh, salt marsh, mangrove, and other landscape features. These details and the bearing trees were digitized to verify approximate position of intertidal boundaries and to confirm the presence or absence of marine water, freshwater, terrestrial, and mangrove or non-mangrove intertidal features. Bearing trees were digitized in point files (trees.shp). The distance and angle to each tree were calculated and digitized in a line file (treebrng.shp). Surveys in Tampa Bay generally recorded two trees per corner, using common terms with no species identification, and tree diameter was not recorded in this region. Surveyors typically posted temporary stakes where no trees were available at section corners or ½-mile markers (quarter-section post). The section lines were also digitized (sectlines.shp). Attribute tables include transcriptions of handwritten notes in the survey record. PLS notes along Old Tampa Bay (west), which extend beyond the study area boundaries, were also digitized and are included in the PLS data.
| Figure 1. T-sheet at Feather Sound showing (A) original survey drawing and (B) digitized interpretation of open water, intertidal mangrove, intertidal non-mangrove, and terrestrial zones. | Figure 2. Example PLS notes showing (A) original hand-written notes and (B) transcription of stopping points, bearing trees, and land rating. | |
|
 |
Regional 19th Century Digital Maps: Entire Tampa Bay and a Florida West Coast Tsheet Mosaic
The Coast and Geodetic Survey (CGS) surveyed the coast of Tampa Bay, Fla., between 1874 and 1878 at 1:20,000 for navigation purposes. In 1879 a compilation T-sheet, T177, was prepared by CGS from the 1:20,000 charts for the entire Tampa Bay area at a scale of 1:80,000 (fig. 3). The scanned chart was acquired by the USGS for a study of the Interbay Peninsula and georectified at 5-m resolution, according to methods outlined in Raabe and Schwarz (2007). A geoTIFF of this historic chart is included in this data release (T177_1879_TBAY.tif).
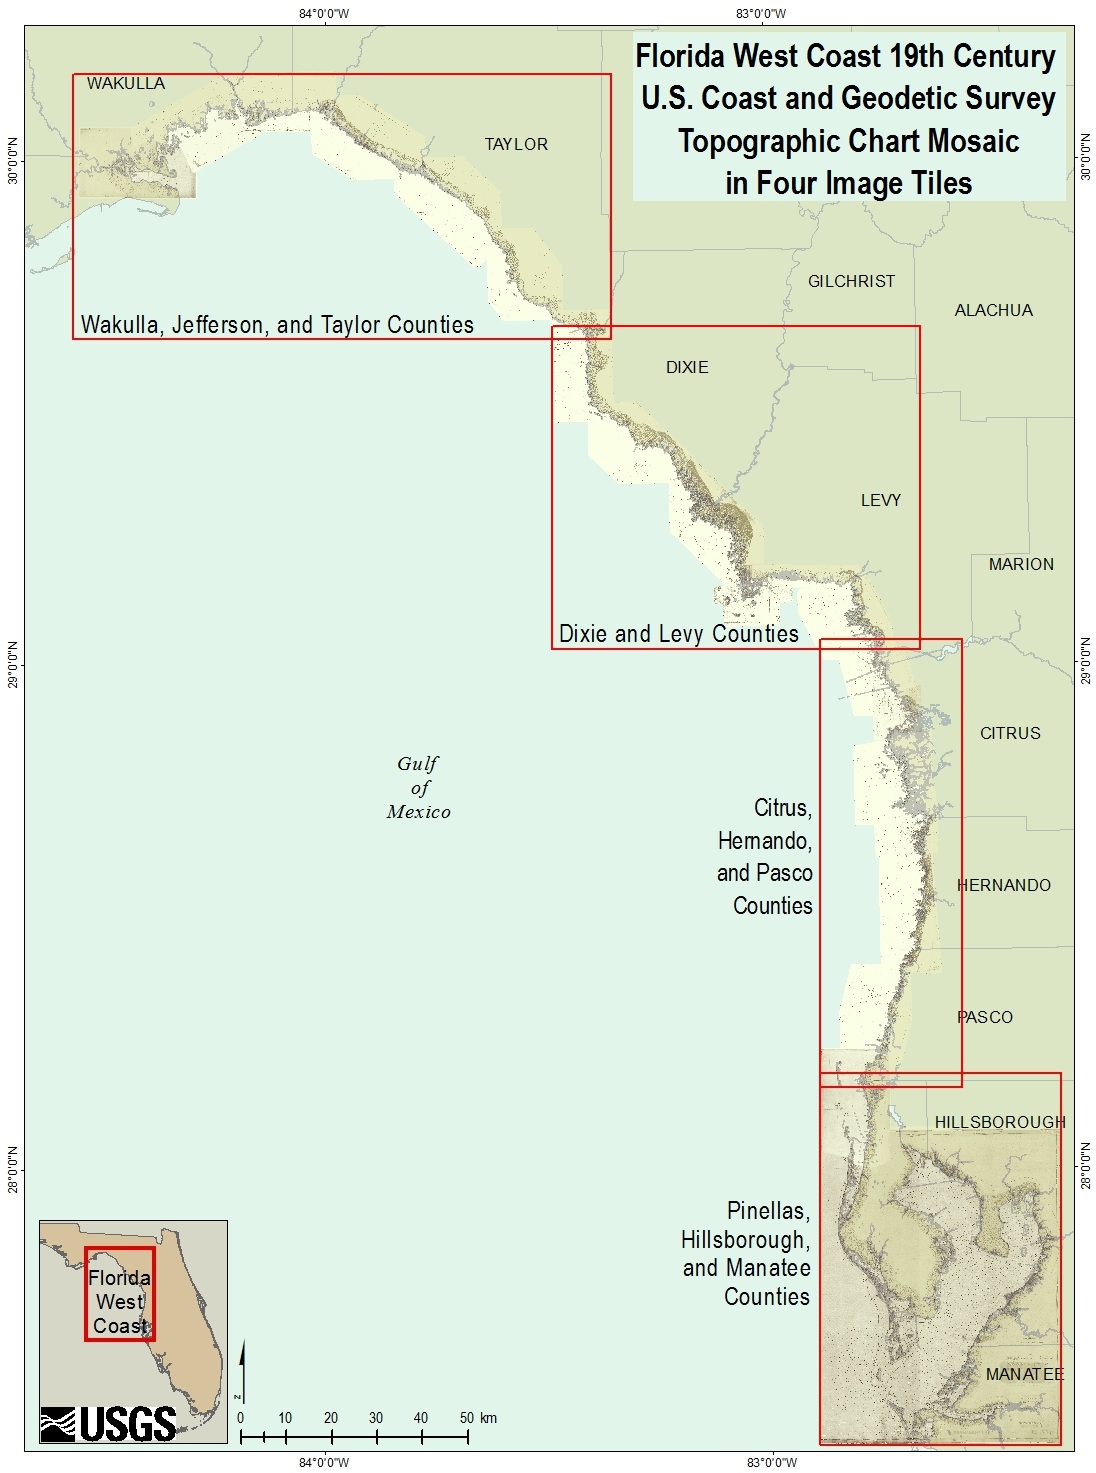
A georeferenced regional mosaic of 19th century surveys (T-sheets) was prepared by the USGS from the Tampa Bay study and two previous USGS studies (fig. 4; Raabe and others, 2004; Raabe and Schwarz, 2007). The mosaic extends from Ocklocknee Bay to Tampa Bay, along a 460-kilometer (km) stretch of Florida's west coast. The 5-m-resolution image includes the nineteen 1:20,000-scale T-sheets from the Big Bend (Raabe and others, 2004), the 1:80,000-scale Tampa Bay T177 (Raabe and Schwarz, 2007), and two connecting charts: Clearwater Harbor to Anclote Keys T1698 surveyed in 1884 and Ocklockonee Bay T771 surveyed in 1859, each at 1:20,000 scale. The majority of the historic coast has been digitized (Raabe and others, 2004). Figure 4 illustrates the geographic extent of the Florida West Coast T-sheet mosaic, divided in four tiles by county: Wakulla, Jefferson and Taylor (Wak_Jef_Tay_Tsheet.tif), Dixie and Levy (Dixie_Levy_Tsheet.tif), Citrus, Hernando, and Pasco (Cit_Her_Pas_Tsheet.tif), and Pinellas, Hillsborough, and Manatee (Pin_Hil_Man_Tsheet.tif) Counties.
| Figure 3. Tampa Bay T-sheet, T177, compiled in 1879 at 1:80,000 scale. Click on image to view larger version. | Figure 4. Florida west coast historic T-sheet mosaic in four image tiles. Click on image to view larger version. | ||
 |
 |

![]() U.S. Department of the Interior |
U.S. Geological Survey
U.S. Department of the Interior |
U.S. Geological Survey
URL: http://pubsdata.usgs.gov/pubs/ds/727/html/methods.html
Page Contact Information: GS Pubs Web Contact
Page Last Modified: Monday, 28-Nov-2016 19:05:37 EST
