Fact Sheet 007-98
U.S. Geological Survey Fact Sheet 007-98 (Published 1998)
By Terry L. Maluk and Robert E. Kelley, II
USGS Fact Sheet FS 007-98
|
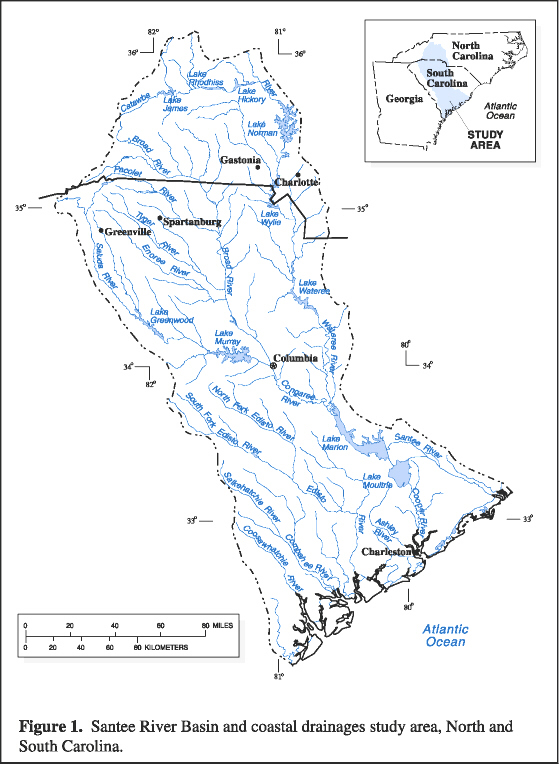
Pesticides in Surface Waters of the Santee River Basin and Coastal Drainages, North and South Carolina Introduction This report summarizes the available pesticide data for surface waters in the Santee River Basin and coastal drainages (SANT) study area, as part of the U.S. Geological Survey (USGS) National Water-Quality Assessment (NAWQA) Program. Data from the U.S. Environmental Protection Agency Storage and Retrieval (STORET) database and data collected by the USGS in the SANT NAWQA study area were assessed. A description of the study area is followed by an estimate of pesticide application data. Detected pesticides and their reported maximum concentrations are summarized. Pesticide concentrations are compared with applicable water-quality standards. Seasonality of pesticide concentrations in surface water in the SANT NAWQA study area also is assessed.
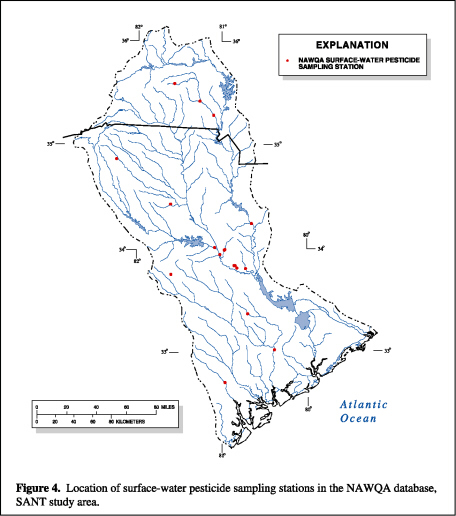
The SANT study area is located in the southeastern United States in central South Carolina and western North Carolina and has a drainage area of about 23,600 square miles (mi2) (fig. 1). The Santee River is the second largest river on the east coast of the United States and its basin makes up about 65 percent of the study area. The Santee River flows about 415 miles (mi) from the mountains of North Carolina to the Atlantic Ocean. Several coastal drainages, primarily the Cooper, Edisto, Salkehatchie, and Coosawhatchie Rivers, make up the remaining 35 percent of the study area (fig. 1). These rivers range in length from less than 10 mi for the smaller creeks to 150 mi for the Edisto River. The lower reaches of the rivers are brackish and affected by tides. Large surface-water impoundments in the study area include Lake Norman (32,510 acres) in North Carolina, and Lakes Murray (51,000 acres), Moultrie (60,400 acres), and Marion (110,600 acres) in South Carolina. The climate in the study area is generally characterized by short, wet winters and long, hot summers. The growing season ranges from about 200 days in the upper part of the study area to about 300 days near the coast. The annual mean precipitation in the study area was about 48 inches per year during 1961-90 (South Carolina Department of Natural Resources, 1997). The 1990 population of the study area was about 3.62 million. The study area contains four major metropolitan areas: Greenville-Spartanburg, Columbia, and Charleston in South Carolina and Gastonia-Charlotte in North Carolina (fig. 1). Urban areas accounted for 6 percent of the study area (fig. 2). About 64 percent of the study area was forested. Forested lands included hardwood-dominated forests, forested wetlands, pine and mixed hardwood forests, and intensively managed pine forests. Croplands represented about 26 percent of the study area, and about 4 percent was water (Anderson and others, 1976). Corn, soybeans, cotton, wheat, and oats were the most common crops and represented over 90 percent of the land planted in 1993 (South Carolina Agricultural Statistics Service, 1995; North Carolina Agricultural Statistics, 1993). Two sets of data were used for this report. Historical data were obtained from the U.S. Environmental Protection Agency STORET database for the years 1973-93. The STORET database contained total and dissolved pesticide data for 267 stations located within the study area (fig. 3). These stations were maintained primarily by the South Carolina Department of Health and Environmental Control (SCDHEC) and the North Carolina Department of Environment and Natural Resources (NCDENR). The sampling frequencies at these stations varied from single samples to monthly samples, with most of the stations sampled approximately annually. The 43 stations with detectable concentrations of pesticides are indicated by the red dots (fig. 3). The second database includes samples collected as part of the SANT NAWQA study from February 1996 through January 1997. Seventeen stations were sampled for dissolved pesticides (fig. 4). The sampling frequencies at these stations varied from quarterly to weekly. All SANT NAWQA stations had detectable concentrations of at least one pesticide.
Pesticides are used on a regular basis for agricultural, commercial, and domestic protection of plants, wood, soil, and many other products from harmful organisms, and to control the growth of certain vegetation. Each of these uses is a possible source of pesticide entry into the environment.
Pesticides may enter surface waters as a result of direct application of herbicides to streams or streambanks to control weed growth. Atmospheric deposition results from precipitation scouring contaminants from the air and depositing them on the ground or directly into the streams. Nonpoint-source runoff of pesticides occurs when rain washes over the ground surface, carrying contaminants with it into nearby streams. Pesticides can also soak into the ground and move into streams where ground water discharges. County-level use estimates of pesticide active ingredients were available for 96 herbicides, 57 insecticides, and 32 fungicides. No fungicides were reported at detectable concentrations in the SANT study area. Nonagricultural pesticide usage is not as well documented as agricultural use. Domestic pesticide application on lawns, home gardens, or around the home are not included in these estimates unless sold to a registered applicator. Nearly 1 million pounds of insecticides and 3 million pounds of herbicides were applied in the SANT study area in 1987 (Gianesse and Puffer, 1991, 1992a, 1992b). The insecticide chlorpyrifos and the herbicides 2,4-D, atrazine, alachlor, and metolachlor were applied in the greatest quantities (fig. 5). Chlorpyrifos is used in urban and agricultural settings for control of a wide variety of insects. Atrazine and alachlor are commonly applied to corn and soybeans during planting, and 2,4-D is applied prior to planting as a general herbicide.
Among 80 pesticides assessed at stations in the STORET database, 28 were reported at or above the detection level at 43 stations (fig. 3; table 1). The most frequently detected pesticides were simetone, 2,4-D, and 2,4-DP. Table
1. Summary of detected pesticides from stations in the STORET database,
1973-93 Table
2. Summary of detected pesticides from all stations in the SANT NAWQA
database, 1996-97
In general, most concentrations were below Federal water-quality criteria. However, 16 pesticides had concentrations that exceeded aquatic life or human health criteria (tables 1 and 2). At stations in the STORET database, maximum concentrations of chlordane, o,p-DDT, p,p-DDT, diazinon, dieldrin, guthion, heptachlor epoxide, lindane, methoxychlor, mirex, parathion, and toxaphene exceeded criteria to protect aquatic life. The maximum lindane concentration also exceeded the lifetime health advisory level (HAL) and maximum contaminant level (MCL). The maximum pentachlorophenol concentration exceeded the MCL. In the SANT NAWQA database, carbaryl, chlorpyrifos, diazinon, dieldrin, malathion, and parathion all exceeded the criteria to protect aquatic life. At sustained high concentrations, these pesticides may be harmful to aquatic organisms. The HAL and MCL are standards for finished drinking water. Surface water provided 86 percent of the public water supply in the SANT study area in 1990 (Hughes, 1994). Although pesticide concentrations in streams may occasionally exceed these standards, water collected by water utilities is treated before it is released for public consumption, and the concentration is likely to decrease as a result of treatment. Were different pesticides found in different environmental settings? Data from two SANT NAWQA stations illustrate variability in pesticide detection from different basin land-use settings (fig. 6). At Gills Creek, an urban creek in Columbia, S.C., over 31 percent of the pesticide detections were insecticides. This is the result of lawn, garden, household, golf course, and commercial pest control. At Cow Castle Creek, a predominantly agricultural setting in rural Orangeburg County, S.C., 15 percent of the pesticide detections were insecticides and 85 percent were herbicides. Herbicide application to crops is common in modern agricultural production.
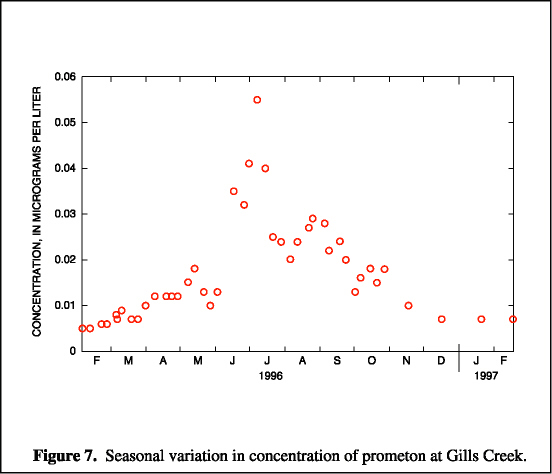
Do pesticide concentrations change during the year? Prometon, an herbicide applied to control grass and brush weeds in noncrop areas and to the ground prior to laying asphalt, showed a seasonal pattern at Gills Creek. Concentrations were low in the winter, increased throughout the spring, peaked during the summer months, then gradually returned to lower winter levels (fig. 7). Pesticide occurrence in surface water often is related to application times and time lapsed before the next rainfall. Other pesticides detected at different stations in the SANT study area that showed seasonal variability include atrazine, chlorpyrifos, deethylatrazine, metolachlor, simazine, and tebuthiuron. Seasonal trends varied with station. Higher pesticide concentrations were also observed during or following rain when runoff into the stream had occurred. References
Fact Sheet FS-007-98 By Terry L. Maluk and Robert E. Kelley, II To order SANT NAWQA publications, please email or call:
|
For more information, contact the South Carolina Publications Unit.
![]() USGS South Carolina Publications • South Carolina Water Science Center
USGS South Carolina Publications • South Carolina Water Science Center

![]() U.S. Department of the Interior |
U.S. Geological Survey
U.S. Department of the Interior |
U.S. Geological Survey
URL: http://pubsdata.usgs.gov/pubs/fs/1998/fs007-98/index.html
Page Contact Information: S.C. Water Science Center
Page Last Modified: Tuesday, 29-Nov-2016 18:09:53 EST