Fact Sheet 085-98
U.S. Geological Survey Fact Sheet 085-98 (Published 1998)
By Lance J. Wilhelm and Terry L. Maluk
USGS Fact Sheet FS 085-98
|
Significant Findings
|
Introduction
High levels of fecal-indicator bacteria in rivers and streams can indicate the possible presence of pathogenic (disease-causing) microorganisms. Cholera, typhoid fever, bacterial dysentery, infectious hepatitis, and cryptosporidiosis are some of the well known waterborne diseases that spread through water contaminated with fecal matter. Eye, ear, nose, and throat infections also can result from contact with contaminated water. In general, methods are not routinely used to detect pathogens in water. Instead, bacteria such as total coliforms, fecal coliforms, fecal streptococci, Escherichia coli (E. coli), and enterococci are used as indicators of sanitary water quality, because they are present in high numbers in fecal material and have been shown to be associated with some waterborne disease-causing organisms. Indicator bacteria usually are harmless, more plentiful, and easier to detect than pathogens. The concentration of bacteria in a sample of water is usually expressed as the number of bacteria colonies per 100 milliliters (col/100mL) of water sample.
 |
 |
|
|
E.
coli bacteria, courtesy of Centers for Disease Control and Prevention
|
|
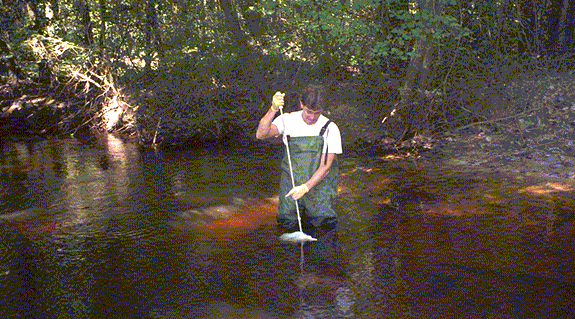
Sampling at Cedar Creek, S.C. |
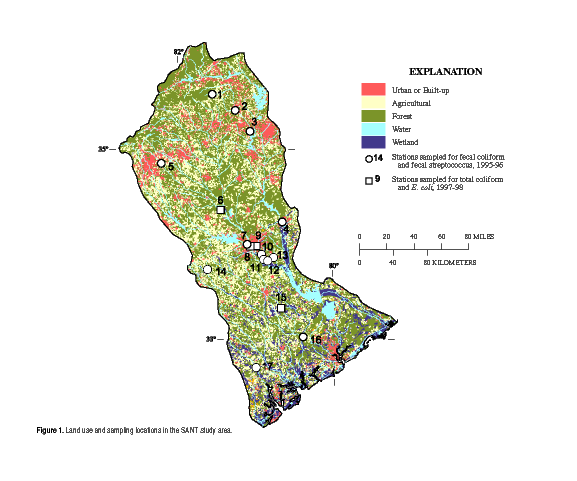
As part of the U.S. Geological Survey (USGS) National Water-Quality Assessment Program (NAWQA), 145 samples were collected and analyzed for selected water-quality constituents, fecal coliforms, and fecal streptococci at 17 sites (fig. 1, table 1) in North and South Carolina from October 1995 through September 1996. Of the original 17 sites, 4 in South Carolina were sampled for E. coli and total coliforms from April through September 1997. At two sites, this sampling continued from October 1997 through April 1998.
Setting
|
|
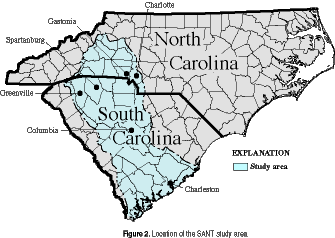
The Santee River Basin and coastal drainages study area (SANT) is about 23,600 square miles (mi2) located in central South Carolina and western North Carolina (fig. 2). The Santee River is about 415 miles (mi) in length and is the second largest river on the east coast of the United States. From the mountains of North Carolina to the Atlantic Ocean, the Santee River Basin makes up approximately 65 percent of the SANT study area. Several coastal drainages, primarily the Cooper, Edisto, Salkehatchie, and Coosawhatchie Rivers, S.C., make up the remaining 35 percent. These rivers range in length from less than 10 mi to about 150 mi. The lower reaches of the rivers are brackish and are affected by tides. The study area includes large surface-water impoundments: Lake Norman (32,510 acres) in North Carolina, and Lakes Murray (51,000 acres), Moultrie (60,400 acres), and Marion (110,600 acres) in South Carolina.
Climate in the study area generally is characterized by short, wet winters and long, hot summers. Growing seasons range from about 200 days in the upper part of the study area to about 300 days near the coast. Annual mean precipitation in the study area was about 48 inches per year during 1961-90 (South Carolina Department of Natural Resources, 1997).
The study area had a 1990 population of about 3.62 million and contains four major metropolitan areas: Greenville-Spartanburg, Columbia, and Charleston in South Carolina and Gastonia-Charlotte in North Carolina (fig. 2). Urban land use accounted for 6 percent of the study area (fig. 1). Forested lands, including hardwood-dominated forests, forested wetlands, pine and mixed hardwood forests, and intensively managed pine forests accounted for 64 percent of the study area land use. Croplands represented about 26 percent of the study area land use, and water represented about 4 percent (Anderson and others, 1976) (fig. 1).
Sources of Fecal-Indicator Bacteria
The presence of certain bacteria can provide clues about the origin of contamination. E. coli and enterococci inhabit the intestinal tract of warm-blooded animals and their presence in water is a direct indication of fecal contamination (North Carolina State University, 1997). Contrary to their name, fecal coliform bacteria are not limited to fecal sources, but also are commonly found in pulp and paper-mill effluents, textile processing-plant effluents, and cotton mill and sugar beet processing wastewaters (Dufour, 1976). Total coliforms include a general group of bacteria, encompassing E. coli, fecal coliforms, as well as common soil microorganisms.
Until recently, fecal streptococcus concentrations have been used in conjunction with fecal coliform concentrations to help identify sources of pollution. Fecal streptococci have fecal sources, but questions concerning variability in survival rates and methods are causing less emphasis to be placed on these organisms and their comparison to fecal coliform. Enterococci, a subgroup of fecal streptococci, is highly regarded as a reliable bacterial indicator for both marine and fresh waters.
Bacterial contamination can originate from point or nonpoint sources. Point sources refer to single, identifiable points of origin. Nonpoint sources have diffuse origins.
Point sources
Nonpoint sources
Table 1. Basin descriptions and summary of fecal coliform data in SANT study area, 1995-96
Water-Quality Standards for Fecal-Indicator Bacteria
States adopt water-quality standards based upon U.S. Environmental Protection Agency (U.S. EPA) guidelines. As detection methods for microorganisms evolve, so do the U.S. EPA guidelines. Currently (1998), South Carolina and North Carolina standards are based on guidelines set forth before 1986.
The South Carolina freshwater standard states fecal coliforms are “Not to exceed a geometric mean of 200/100 mL, based on five consecutive samples during any 30 day period; nor shall more than 10% of the total samples during any 30 day period exceed 400/100 mL.” If only one sample is collected in a 30-day period, then that single sample should not exceed 400 col/100 mL. For shellfish harvesting waters, the fecal coliform median is not to exceed 14 col/100 mL, nor shall more than 10 percent of the samples exceed 43 col/100 mL (South Carolina Department of Health and Environmental Control, 1992).
North Carolina uses a freshwater fecal coliform standard. Fecal coliforms “shall not exceed a geometric mean of 200/100 mL, based on five consecutive samples examined during any 30-day period, nor exceed 400/100 mL in more than 20 percent of the samples examined during such period; violations of the fecal coliform standard are expected during rainfall events, and in some cases, this violation is expected to be caused by uncontrollable nonpoint source pollution.” North Carolina water-supply streams have a total coliform standard “not to exceed 50/100 mL..., as a monthly geometric mean in watersheds serving as unfiltered water supplies” (North Carolina Department of Environment and Natural Resources, 1997).
In 1986, U.S. EPA recommended the use of enterococci as the fecal-indicator bacteria for recreational water-quality standards. The geometric mean of at least 5 enterococci samples collected over a 30-day period may not exceed 33 col/100 mL in freshwater, or 35 col/100 mL in marine water (U.S. Environmental Protection Agency, 1986).
Fecal-Indicator Bacteria Sampling and Analysis
 |
 |
|
|
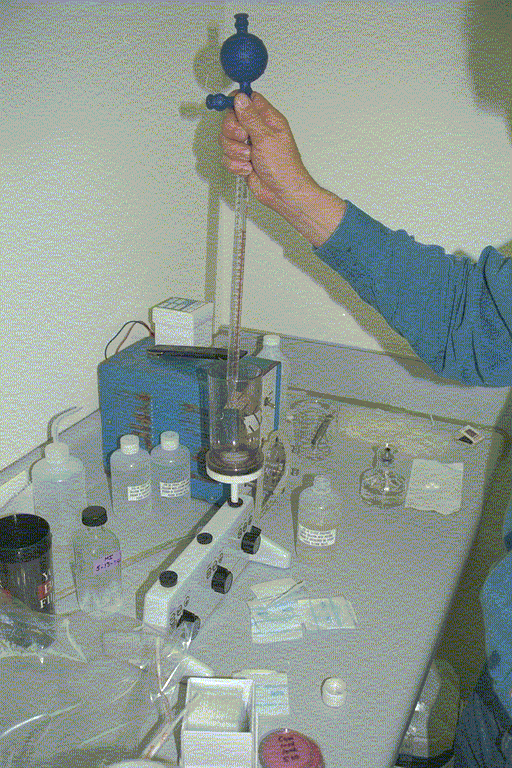
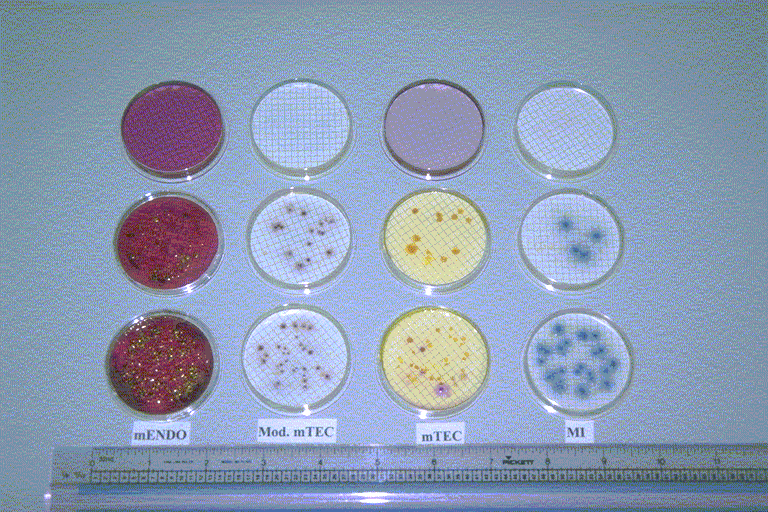
Membrane
filtration technique
|
|
Different types of bacteria cultures |
Samples were collected in sterile containers and processed within 6 hours of collection (Myers and Sylvester, 1997). Membrane filtration methods were used for each sample (see photograph below). These methods involve filtering water samples through membranes with small pores, (0.45 or 0.65 micrometers). Indicator bacteria are too large to pass through these small pores and are caught on the surface of the membrane.
The membrane is then placed on a plate with growth media designed to encourage the growth of indicator bacteria and to restrict growth of nontarget bacteria. These plates are incubated for 24 or 48 hours at temperatures ideal for specific fecal-indicator bacteria. Each plating technique allows indicator bacteria colonies to grow, differentiated by color for easy identification and counting (see photograph below). Finally, colony counts are converted to concentrations mathematically for use in data analysis. These methods are described at length by American Public Health Association and others (1995). Data analysis methods used include nonparametric (Kendall’s tau) tests for correlation of water-quality constituents with fecal-indicator bacteria and the Kruskal-Wallis test, a nonparametric analysis of ranks, for comparison of land-use types (Helsel and Hirsch, 1995).
Results of Fecal-Indicator Bacteria Analysis
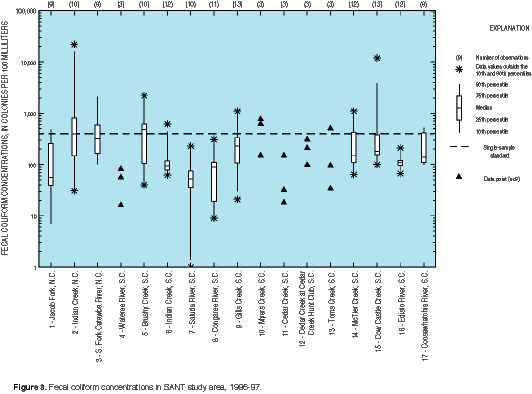 Figure 3. Fecal coliform concentrations in the SANT
study area, 1996-97.
Figure 3. Fecal coliform concentrations in the SANT
study area, 1996-97. |
Because North and South Carolina use fecal coliform as an indicator bacteria for freshwater standards, emphasis is placed on data analysis that relate to State regulations. Fecal coliform concentrations in the SANT study area ranged from less than 1 to over 20,000 col/100 mL (fig. 3). At least one sample from 11 of the 17 stations exceeded the North and South Carolina fecal coliform standard of 400 col/100 mL (table 1). The highest single fecal coliform concentrations were observed at Indian Creek, N.C. (21,600 col/100mL), and Cow Castle Creek, S.C. (12,000 col/100mL), predominantly agricultural basins. At stations with nine or more samples, the highest median concentrations were observed at Brushy Creek, S.C. (480 col/100 mL) and Indian Creek, N.C. (397 col/100 mL). Myers Creek, S.C. had two out of three samples above the fecal coliform standard (table 1).
Fecal streptococcus concentrations ranged from 2 to over 20,000 col/100 mL and were more variable than fecal coliform concentrations. Stations with the highest single fecal streptococcus concentrations were the South Fork Catawba River, N.C. (>20,000 col/100 mL) and Cow Castle Creek, S.C. (10,000 col/100 mL). At stations with eight or more samples, the highest median concentrations were observed at Cow Castle Creek, S.C. (517 col/100mL), and Indian Creek, N.C. (485 col/100 mL), predominately agricultural basins.
Total coliform and E. coli were sampled at four stations in South Carolina (Congaree River, Indian Creek, Gills Creek, and Cow Castle Creek). Cow Castle Creek, S.C., had the highest single total coliform (28,000 col/100 mL) and E. coli (9,600 col/100 mL) concentrations. Cow Castle, S.C., also had the highest median concentrations for total coliform (5,700 col/100 mL) and E. coli (380 col/100 mL). Indicator bacteria concentrations were higher and more variable at Cow Castle Creek, S.C., and Indian Creek, S.C., than at Gills Creek, S.C., or the Congaree River, S.C.
Statistically significant correlations between fecal-indicator bacteria concentrations and selected water-quality constituents varied from station to station. Streamflow, water temperature, pH, alkalinity, sediment, nitrate, ammonia, organic nitrogen, total phosphorus, organic carbon, silica, and percent saturation of dissolved oxygen were significantly correlated with some fecal-indicator bacteria concentrations. Significant correlations (alpha = 0.05) of some fecal-indicator bacteria with at least one water-quality constituent were observed at all stations except Indian Creek, N.C.
Positive correlations at Cow Castle Creek, S.C., included streamflow, organic nitrogen, organic carbon, and phosphorus; negative correlations included dissolved oxygen saturation, nitrate nitrogen, and silica. Positive correlations at Indian Creek, S.C., included streamflow, temperature, phosphorus, organic nitrogen, organic carbon, and sediment; negative correlations included pH, alkalinity, and chloride. These correlations suggest that the source of the bacteria is surface-water runoff, because organic nitrogen, organic carbon, phosphorus, and sediment are most likely to increase at higher streamflows and dissolved oxygen tends to decrease at lower flows. Nitrate nitrogen, chloride, and silica generally are found at higher concentrations in ground water than in surface water. Since ground-water discharge represents a larger proportion of the streamflow during low-flow conditions in these basins, the negative correlation of nitrate nitrogen, chloride, and silica with fecal-indicator bacteria concentrations suggests that surface-water runoff is the source.
Based on grouped data analysis, fecal coliform, fecal streptococcus, and E. coli concentrations were more variable at stations in predominantly agricultural basins (Cow Castle Creek, S.C., and Indian Creek, N.C.) than at stations in forested, urban, or mixed basins. Total coliform concentrations were similar in agricultural and forested basins. Urban and mixed land-use basins had lower total coliform concentrations than did agricultural and forested basins. Large basins with multiple land uses (Congaree, Coosawhatchie, Edisto, Saluda, and Wateree Rivers, S.C., and South Fork Catawba, N.C.) had the lowest concentrations of fecal-indicator bacteria.
Additional Research
Methods for analyzing fecal-indicator bacteria are evolving. Fecal coliform concentrations as indicators of contamination were originally intended and continue to be used by water-supply and wastewater-treatment plants to determine compliance with State standards. The U.S. EPA is recommending the use of E. coli or enterococci as indicators for State standards for freshwater, and enterococci for marine water (U.S. Environmental Protection Agency, 1986). These indicator bacteria are recommended because of their strong relation with swimming-associated illness. Enterococci can be used as an indicator organism in both freshwater and marine water, making tests easier to perform and standards easier to understand and enforce. Concurrent tests of fecal coliform and enterococcus concentrations are being compared at multiple stations in the SANT study area. Future research could focus on the effect of nonpoint sources of pollution and on the development of monitoring methods to determine the public health risk of fecal-contaminated streams.
References
American Public Health Association, American Water Works Association, and Water Environment Federation, 1995, Standard methods for the examination of water and wastewater (19th ed.): Washington, D.C., American Public Health Association [variously paged].
Anderson, J.R., Hardy, E.E., Roach, J.T., and Witmer, R.E., 1976, A land use and land cover classification system for use with remote sensor data: U.S. Geological Survey Professional Paper 964, 28 p.
Cooney, T.W., Jones, K.H., Drewes, P.A., Gissendanner, J.W., and Church, B.W., 1997 Water Resources Data--South Carolina Water Year 1996: U.S. Geological Survey Water-Data Report SC-96-1, 476 p.
Dufour, A.P., 1976, Escherichia coli: the fecal coliform, in bacterial indicators/health hazards associated with water, in Hoadley, A.A., and Dutka, B.J., eds., ASTM STP 635: American Society for Testing and Materials, p. 48-58.
Helsel, D.R., and Hirsch, R.M., 1995, Statistical methods in water resources: New York, Elsevier, 522 p.
Myers, D.M., and Sylvester, M.A., 1997, National field manual for the collection of water-quality data, biological indicators: U.S. Geological Survey Techniques of Water-Resources Investigations, book 9, chapter A7, 49 p.
North Carolina Department of Environment and Natural Resources, 1997, Classifications and water quality standards applicable to surface water and wetlands of North Carolina: Division of Water Quality, 41 p.
North Carolina State University, 1997, accessed on February 13, 1998, Bacteria: on the World Wide Web at URL http://h20sparc.wq.ncsu.edu/info/bacteria/html. [Archived copy (dated February 13, 1998) available for review at the U.S. Geological Survey, Columbia, South Carolina District office.]
Ragland, B.C., Smith, D.G., Barker, R.G., Rinehardt, J.F., and Robinson, J.B., 1997, Water Resources Data -- North Carolina Water Year 1996: U.S. Geological Survey Water-Data Report NC-96-1, 514 p.
South Carolina Department of Health and Environmental Control, 1992, Water classifications and standards (Regulation 61-68): South Carolina Department of Health and Environmental Control, 35 p.
South Carolina Department of Natural Resources, accessed October 29, 1997, South Carolina average annual rainfall, 1961-1990: On the World Wide Web at URL http://water.dnr.state.sc.us/climate/sco/products/avgprec.gif. [Archived copy (dated November 14, 1997) available for review at the U.S. Geological Survey, Columbia, South Carolina District Office.]
U.S. Environmental Protection Agency, 1986, Ambient water quality criteria for bacteria - 1986: U.S. Environmental Protection Agency, 440/5-84-002, 18 p.
|
The U.S. Geological Survey (USGS) is conducting an assessment of water quality in the Santee River Basin and coastal drainages (SANT) study area as part of the National Water-Quality Assessment (NAWQA) Program. The long-term goals of NAWQA are to describe the status of and trends in the quality of a large representative part of the Nation’s surface- and ground-water resources and to identify major factors that affect the quality of these resources. A total of 59 hydrologic systems are to be studied that include parts of most major river basins and aquifer systems in the Nation. The assessment activities in the SANT study area began in 1994. |
Special Thanks - To Donna Francy and the USGS Ohio District Office, for
support, training and guidance.
--- October 1998
Fact Sheet FS-085-98
By Lance J. Wilhelm and Terry L. Maluk
To order SANT NAWQA publications, please email or call:
Celeste A. Journey
Acting SANT NAWQA Project Chief
cjourney@usgs.gov
(803) 750-6141
For more information, contact the South Carolina Publications Unit.
![]() USGS South Carolina Publications • South Carolina Water Science Center
USGS South Carolina Publications • South Carolina Water Science Center

![]() U.S. Department of the Interior |
U.S. Geological Survey
U.S. Department of the Interior |
U.S. Geological Survey
URL: http://pubsdata.usgs.gov/pubs/fs/1998/fs085-98/index.html
Page Contact Information: S.C. Water Science Center
Page Last Modified: Tuesday, 29-Nov-2016 18:09:51 EST