
U.S. Geological
Survey
Fact Sheet 175-99 Online Version 1.0
El Niño Sea-Level Rise Wreaks Havoc in California's San Francisco Bay Region
| During the winter of 1997—98, wind-driven waves and abnormally high sea levels significantly contributed to hundreds of millions of dollars in flood and storm damage in the San Francisco Bay region. Recent analyses by U.S. Geological Survey (USGS) scientists of nearly 100 years of sea-level records collected near the Golden Gate Bridge found that these abnormally high sea levels were the direct result of that year's El Niño atmospheric phenomenon. The USGS continues to investigate the causes of such sea-level changes in order to better protect coastal communities from their effects. |
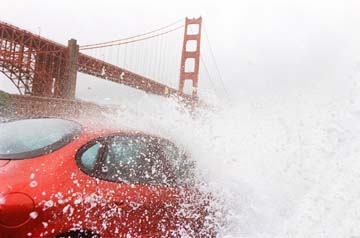
Throughout the first week of February 1998, high winds and heavy rains combined with abnormally high tides to wreak havoc in the San Francisco Bay region. The Pacific Ocean surged over parking lots and the coastal highway at San Francisco's Ocean Beach, and whitecaps up to 6 feet high splashed over the city's waterfront Embarcadero for the first time in recent memory. Elsewhere, U.S. Highway 101 north of the Golden Gate Bridge was flooded by as much as 4 feet of water from San Francisco Bay, and other low-lying areas around the bay were also swamped, forcing hundreds of people to flee their homes.
 |
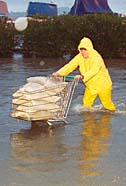 |
| A huge wave breaks over the seawall at Fort Point under the Golden Gate Bridge and crashes onto a parked car on February 1, 1998. Throughout the following week, high winds and heavy rains combined with abnormally high tides to wreak havoc in the San Francisco Bay region. Inset photo shows a worker hauling sandbags through floodwaters in Sausalito, north of the Golden Gate Bridge, on February 7. U.S. Geological Survey scientists have shown that these extreme conditions were the direct result of the 1997—98 El Niño atmospheric phenomenon. (Photos by Lea Suzuki and Vince Maggiora / copyright San Francisco Chronicle.) | |
The abnormally high tides that made some of this flooding the worst in more than 40 years resulted from an unusually high sea level along the west coast of North America. This elevated sea level was caused by the strong El Niño atmospheric phenomenon of 1997—98, which also produced severe winter storms. On February 3, the day of some of the worst flooding, the early-morning high tide at Fort Point near the Golden Gate Bridge measured 5 feet above mean sea level. This tide was about 2 feet higher than would be expected on the basis of the well-understood solar and lunar gravitational forces that create tides. These forces are calculated years in advance and are used to compile tide tables published by the National Ocean Service (NOS), an agency of the National Oceanic and Atmospheric Administration (NOAA).
Sea-level measurements have been collected at Fort Point since before 1900, and these form the longest continuous sea-level record for any site on the west coast of North America. The measurements have been recently compiled in digital form by NOS and analyzed by U.S. Geological Survey (USGS) scientists. This analysis found that four major factors influence sea level at Fort Point—daily tides, annual sea-level cycles, a long-term trend of slowly rising sea level, and the occurrence of atmospheric events such as El Niños and La Niñas.
The biggest influence on sea level is tidal. High and low tides occur twice each day, with a maximum difference in San Francisco Bay of about 6.5 feet.
A second important influence on sea level at Fort Point is an annual cycle in which levels are lower in spring and higher in early autumn through winter. The spring drop in sea level along the California coast results from the onset of strong winds blowing toward the Equator. These winds plus the Coriolis effect (the tendency of winds and currents to veer to the right in the Northern Hemisphere and to the left in the Southern Hemisphere) push surface waters away from the coast. To fill their place, colder water rises to the surface in the yearly upwelling that makes the ocean off northern California so cold in spring and summer. The higher sea levels in autumn and winter are produced by relaxation of the alongshore winds that push surface water away from the coast and by expansion of the water caused by summer and fall warming.
|
FORT
POINT SEA-LEVEL RECORD
|
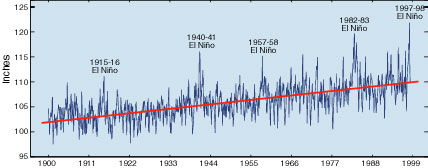 |
| Sea-level measurements collected at Fort Point in San Francisco since before 1900 form the longest continuous sea-level record for any site on the west coast of North America. This record was recently analyzed by U.S. Geological Survey scientists, who found that four major factors influence sea level at Fort Point—daily tides, annual sea-level cycles, a long-term trend of slowly rising sea level (red line), and the occurrence of atmospheric events such as El Niños and La Niñas. |
|
WATER
MOVEMENTS AND WINDS OFF THE NORTHERN CALIFORNIA COAST
|
|
|
TYPICAL
SPRING AND SUMMER CONDITIONS |
The normal spring drop in sea level along the California coast results from the onset of strong winds blowing toward the Equator. These winds plus the Coriolis effect (the tendency of winds and currents to veer to the right in the Northern Hemisphere and to the left in the Southern Hemisphere) push surface waters away from the coast. To fill their place, colder water rises to the surface in the yearly upwelling that makes the ocean off northern California so cold in spring and summer. During La Niñas, upwelling conditions are intensified. Higher sea levels in autumn and winter are produced by relaxation of the alongshore winds that push surface water away from the coast and by expansion of the water caused by summer and fall warming. Northward and onshore flow of warmer surface waters during El Niños intensifies these effects and causes downwelling, which prevents the replenishment of nutrients to surface waters and can have a major impact on sea life. For example, in 1997—98, thousands of seals and sea lions starved to death when downwelling warm water drove away many of the fish and squid on which they normally fed. Young animals, such as the sea lion pup shown below, were particularly vulnerable.
|
|
STRONGLY
REVERSED CONDITIONS, COMMON |
|
A long-term sea-level rise of about 0.04 to 0.08 inches per year is documented in the Fort Point record. Similar trends of slowly rising sea level have been observed elsewhere along the west coast of North America and in other parts of the world. Many scientists think that rising sea level may be the result of increased melting of the polar icecaps and thermal expansion of ocean water caused by global warming.
The fourth factor affecting sea level at Fort Point is the occurrence of atmospheric events such as El Niños. What are El Niños, and how do they create abnormally high sea levels in the San Francisco Bay area? During most years, equatorial trade winds blow from east to west, piling up warm surface water on the west side of the Pacific Ocean. Every 2 to 7 years, the trade winds relax, or even reverse, and the warm surface water moves back along the Equator toward South America. Because the resulting warm-water conditions off the west coast of South America significantly disrupt fish populations and usually become noticeable around Christmas, fishermen named this phenomenon "El Niño" after the Christ child. The name "La Niña" is now given to an opposite phenomenon that brings unusually cold-water conditions.
As part of an El Niño, unusually long, low waves are generated in the western Pacific Ocean and move eastward along the equator. These waves—called "Kelvin waves"—are difficult to observe and are still rather poorly understood. They appear to be about 6,000 miles long, to travel at speeds of more than 5 miles an hour, and to have heights of up to 10 inches. When a Kelvin wave hits South America, the wave splits and moves northward and southward along the coast. The passage of a Kelvin wave along the coast causes sea level to rise by an amount equal to the height of the wave. As a Kelvin wave moves along the west coast of North America and passes the mouth of San Francisco Bay, the higher sea level outside the bay causes ocean water to flow into the bay and raise its level as well.
The Fort Point record shows evidence for Kelvin waves raising sea level in 1997 by about 6 inches as early as late May, earlier than in previous El Niño years. These Kelvin waves also raised ocean temperatures near San Francisco, and by the late fall of 1997, water temperatures off the coast were well above normal to depths of 300 feet or more. The resulting thermal expansion of the water caused an additional rise in sea level of about 8 inches that lasted until after the flooding of February 1998.
|
PROGRESS
OF A KELVIN WAVE DURING THE 1997—98 EL NIÑO
|
|
 |
|

|
|
| As part of an El Niño, unusually long, low waves, called "Kelvin waves," are generated in the western Pacific Ocean and carry warm water eastward along the Equator. The satellite images of sea-surface elevation (top), taken in March and April 1997, show the progress of a Kelvin wave (high sea-surface elevations shown in white and red) across the equatorial Pacific. When the wave hit South America, it split and moved northward and southward along the coast. The passage of the wave along the coast caused sea level to rise by an amount equal to the height of the wave, about 6 inches. As the Kelvin wave moved along the west coast of North America and passed the mouth of San Francisco Bay (bottom satellite images of sea-surface temperature), the higher sea level outside the bay caused ocean water to flow into the bay and raise its level as well. (Satellite images from California Institute of Technology, Jet Propulsion Laboratory.) |
During winter in California, storms typically bring high rainfall, low atmospheric pressure, and strong winds. The low atmospheric pressure in storm systems allows ocean waters to expand, resulting in a temporary increase in sea level. Every 1-inch decrease in atmospheric pressure causes a 1-inch rise in sea level. Unusually low-pressure systems can result in a sea-level increase of up to 8 to 10 inches. Along the northern California coast, strong storm-related winds from the south combine with the Coriolis effect to push surface ocean waters toward the coast and into San Francisco Bay, raising sea level as much as 10 to 12 inches.When El Niño conditions are present, not only are storms more frequent and severe, but the winds are also more likely to blow from the south.
|
RELATION OF WATER TEMPERATURE TO SEA LEVEL DURING THE 1997—98 EL NIÑO |
 |
|
 |
 |
Tide-gauge records from Fort Point in San Francisco show evidence for Kelvin waves raising sea level in 1997 by about 6 inches as early as late May, earlier than in previous El Niño years. As recorded by U.S. Geological Survey instruments (photo below graph) anchored off the northern California coast at Davenport mooring (see map on left), these Kelvin waves also raised ocean temperatures. By the late fall of 1997 water temperatures off the coast were well above normal to depths of 300 feet or more. The resulting thermal expansion of the water caused an additional rise in sea level of about 8 inches that lasted until after the flooding of February 1998. |
The El Niño of 1997—98 was followed by La Niña conditions the following winter. These conditions caused unusually strong upwelling of cold, nutrient-rich waters off the northern California coast.
To better understand the effects of El Niño conditions and other influences on sea level, USGS scientists continue to monitor sea-level changes in San Francisco Bay. They also are collecting and analyzing ocean current, temperature, and pressure data from the waters off California's coast near Santa Cruz and the Farallon Islands. These studies will help ocean scientists develop models for predicting sea-level changes in San Francisco Bay and will aid in anticipating coastal flooding in the region. This work is only part of the USGS Coastal and Marine Geology Program's ongoing efforts to protect people's lives and property from geologic and environmental hazards in the coastal zones of the United States.
By
Holly
Ryan, Helen Gibbons, James W. Hendley II, and Peter Stauffer
Graphic design by Sara Boore and Susan Mayfield
Web design by Carolyn Donlin
COOPERATING ORGANIZATIONS
National
Oceanic and Atmospheric Administration,
National Ocean Service
Download a PDF version of this four-page color fact sheet
For more
information contact:
U.S. Geological Survey, MS-999
345 Middlefield Road
Menlo Park, CA 94025
(650) 329-5042
To find out more about marine and coastal studies, visit the USGS Coastal and Marine Geology Program website.
REDUCING THE RISK FROM COASTAL GEOLOGIC HAZARDS
URL of this page:
https://pubs.usgs.gov/fs/1999/fs175-99/
Maintained by: Michael Diggles
Last modified: May 9, 2005 (mfd)