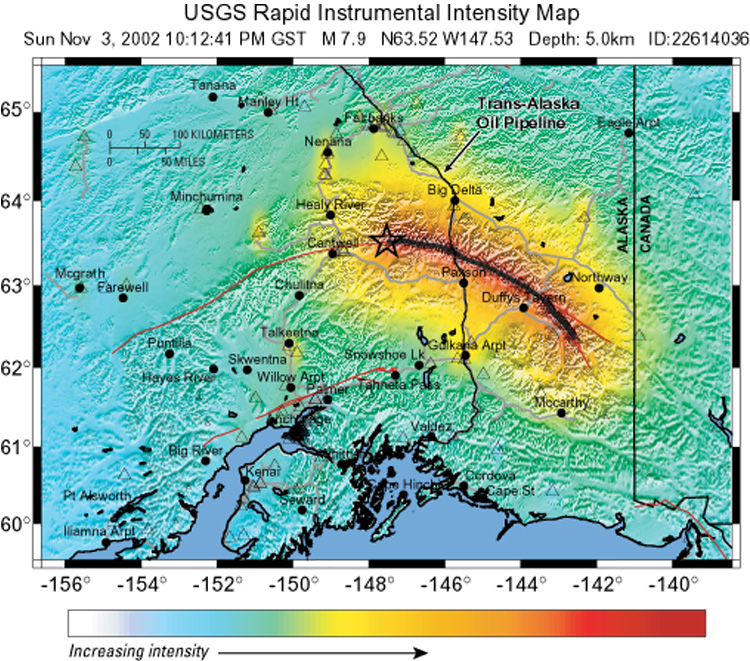
A "ShakeMap"
portraying shaking intensities during the November 3, 2002, Denali Fault
earthquake (above) was released a few days after the quake by the U.S.
Geological Survey (USGS) and the Alaska Earthquake Information Center
(AEIC) at the University of Alaska Fairbanks. This ShakeMap, the first
produced for Alaska, was created using data from about 50 seismic instruments
across the State, including some managed by the Alyeska Pipeline Service
Company at pump stations along the Trans-Alaska Oil Pipeline.
Because of the vast area shaken by the magnitude 7.9 quake and the relatively
small number of seismic recordings from near the fault (two-thirds of
the data were from Anchorage), this ShakeMap offers only a generalized
picture of the intensity of the ground shaking. Nonetheless, this map
shows a pattern for the Denali Fault region remarkably similar to that
on a map of shaking hazard for Alaska that was produced by USGS scientists
in 1999 (shown below).
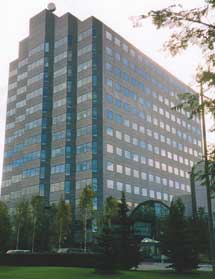
One purpose of ShakeMaps is to provide rapid information to aid emergency managers in responding to a quake. Another purpose of ShakeMaps is to reveal local variations in shaking that engineers can use to better design buildings to withstand earthquakes. To realize both these goals, the USGS and its cooperators have begun building a dense nationwide network, called the Advanced National Seismic System (ANSS), to consist of at least 7,000 sophisticated shaking monitors. These instruments are being placed both on the ground and in buildings. Because building failures are what kill the most people in earthquakes, the data that can be provided by ANSS will be crucial in saving lives in future quakes.
(areas of highest hazard in red)
1999