
Water-Level Changes in the High Plains Aquifer,
Predevelopment to 2002, 1980 to 2002, and 2001 to 2002
Fact Sheet 2004–3026
—By V.L. McGuire
Available from the U.S. Geological Survey,
Branch of Information Services, Box 25286,
Denver Federal Center, Denver, CO 80225, USGS Fact Sheet 2004-3026.
(Requires Adobe Acrobat Reader)
The High Plains aquifer underlies one of the major agricultural regions in the world, including parts of eight states—Colorado, Kansas, Nebraska, New Mexico, Oklahoma, South Dakota, Texas, and Wyoming. In the 104.5 million-acre area overlying the High Plains aquifer, not including areas with little or no saturated thickness (fig. 1), the total number of acres irrigated with ground water increased rapidly after 1940. Irrigated acres comprised 2.0 percent of the aquifer area in 1949, 13.1 percent in 1980, and 13.3 percent in 1997—(Heimes and Luckey, 1982; Thelin and Heimes, 1987; U.S. Department of Agriculture, 1999). Water-level declines started to occur in the High Plains aquifer soon after the beginning of extensive ground-water irrigation. The water-level declines in the High Plains aquifer occur because of an imbalance between discharge, the largest component of which is ground-water withdrawals for irrigation, and recharge, which is primarily from precipitation. By 1980, water levels in the High Plains aquifer in parts of Texas, Oklahoma, and southwestern Kansas had declined more than 100 feet (Luckey and others, 1981). Water-level declines may result in increased costs for ground-water withdrawals because of increased pumping lift and decreased well yields. Water-level declines also can affect ground-water availability, surface-water flow, and riparian areas. In response to the water-level declines in the High Plains aquifer, the U.S. Geological Survey, in cooperation with numerous Federal, State, and local water-resource agencies, began monitoring more than 7,000 wells in 1988 to assess the annual water-level change in the aquifer. The purpose of this report is to present water-level changes in the High Plains aquifer from the time prior to substantial ground-water irrigation development (about 1950, which is termed “predevelopment” in this report) to 2002, 1980 to 2002, and 2001 to 2002. The water-level measurements used in this report were collected in winter or early spring when irrigation wells generally were not pumping and when water levels generally had recovered from the stress of pumping during the previous irrigation season. |
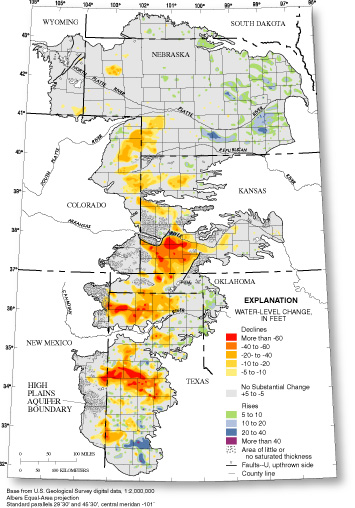
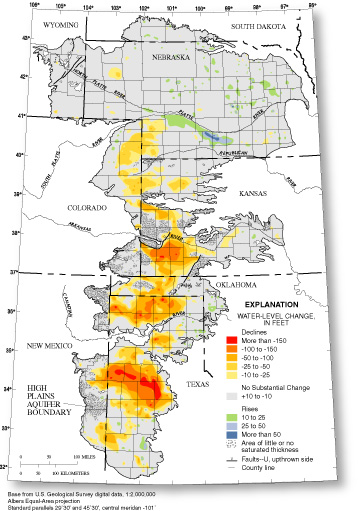 Figure 1. Water-level changes in the High Plains aquifer, predevelopment to 2002 (modified from Luckey and others, 1981 McGuire and others, 2003). |
|
|
Figure 2. Water-level changes in the High Plains aquifer, 1980 to 2002. |
||
| The
water-level-change maps and related area-weighted average water-level
change values in this report were prepared using two methods. The
maps of water-level changes, predevelopment to 2002 (fig. 1) and
1980 to 2002 (fig. 2), show contours of water-level-change ranges,
which were drawn manually based on predevelopment, 1980, and 2002
water levels from available wells, contours of water-level changes
from previous reports (Luckey and others, 1981; McGuire and others,
2003), and predevelopment and recent water-table maps, if available.
The map of generalized water-level changes, 2001 to 2002 (fig. 3),
shows computer-generated Thiessen polygons (Thiessen, 1911) colored
by the water-level-change range. Thiessen polygons apportion the
water-level change in each well to an area around the well; the
size of each polygon depends on the proximity of neighboring wells.
The predevelopment to 2002 and 1980 to 2002 areaweighted average
water-level changes were computed for each comparison period by
summing the areas within the manual contours of water-level change
multiplied by the value of the mid-point of the contour interval
and dividing the result by the total area. The 2001 to 2002 area-weighted
average water-level change was computed by summing the area of each
Theissen polygon times the actual water-level change value associated
with the Theissen polygon and dividing the result by the total area.
|
||
|
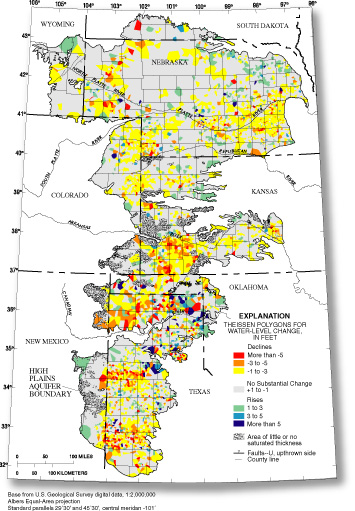
Figure 3. Generalized water-level changes in the High Plains aquifer, 2001 to 2002. | ||
WATER-LEVEL CHANGES, PREDEVELOPMENT TO 2002 The map of water-level changes in the High Plains aquifer from predevelopment to 2002 (fig. 1) is based on water levels from 3,860 wells (table 1). Ninety-nine percent of water-level changes from predevelopment to 2002 in the 3,860 wells used were between a rise of 39 feet and a decline of 167 feet. The area-weighted average water-level change across the High Plains aquifer, not including the areas with little or no saturated thickness, was a decline of 12.1 feet (table 2). About 24 percent of the aquifer area, not including the areas with little or no saturated thickness, had more than 10 feet of water-level decline from predevelopment to 2002. Large areas with more than 50 feet of water-level decline occurred in southwest Kansas, east-central New Mexico, the central part of the Oklahoma Panhandle, and the western part of the Texas Panhandle. WATER-LEVEL CHANGES, 1980 TO 2002 Ninety-nine percent of all water-level changes from 1980 to 2002 in the 4,746 wells used were between a rise of 30 feet and a decline of 81 feet. The area-weighted average water-level change across the High Plains aquifer, not including the areas with little or no saturated thickness, was a decline of 4.0 feet (table 2). About 20 percent of the aquifer area, not including the areas with little or no saturated thickness, had more than 5 feet of water-level decline from 1980 to 2002. Large areas with more than 40 feet of water-level decline occurred in southwest Kansas, east-central New Mexico, the central part of the Oklahoma Panhandle, and the western part of the Texas Panhandle. WATER-LEVEL CHANGES, 2001 TO 2002 Ninety-nine percent of water-level changes from 2001 to 2002 in the 7,998 wells used were between a rise of 7 feet and a decline of 9 feet. The area-weighted average water-level change across the High Plains aquifer, not including the areas with little or no saturated thickness, was a decline of 0.6 foot (table 2). Water-level declines occurred over most of the aquifer, excluding the parts of the aquifer with little or no saturated thickness, but water-level rises greater than 3 feet occurred in parts of northeastern Nebraska, the Texas Panhandle, and western Oklahoma (fig. 3). CHANGE IN WATER IN STORAGE, PREDEVELOPMENT TO 2002 Because the High Plains aquifer is generally unconfined, the change in water in storage in the High Plains aquifer can be estimated using the water-level change maps (figs. 1, 2, and 3) and the average specific yield of the aquifer in each State (Gutentag and others, 1984). Specific yield is an estimate of the volume of water that a volume of the aquifer will yield by gravity drainage (Lohman, 1979). Total water in storage in the aquifer in 2002 was estimated to be 2,970 million acre-feet. The water in storage declined about 200 million acre-feet from predevelopment to 2002, about 67 million acre-feet from 1980 to 2002, and about 10 million acre-feet from 2001 to 2002 (fig. 4, table 3). This method for calculating the change in water in storage will overestimate the change in storage in local areas if the aquifer reflects confined conditions at the start of the time period and unconfined conditions later. |
||
|
||
|
|
||
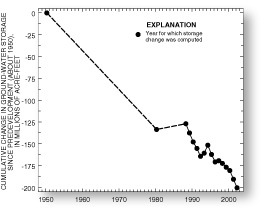
Figure 4. Cumulative change in ground-water storage in the High Plains aquifer since predevelopment (modified from U.S. Geological Survey, 2002). REFERENCES
|
||
| For additional
information contact: U.S. Geological Survey Federal Bldg., Room 406 100 Centennial Mall North Lincoln, NE 68508 (402) 4375082 USGS Nebraska District home page: http://ne.water.usgs.gov |
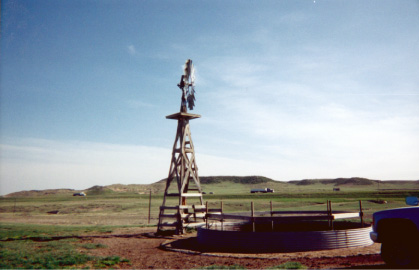
Wind-powered well and livestock watering tank in
Platte County, Wyoming |
|
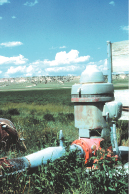
Irrigation well in Laramie County, Wyoming (Photograph courtesy of R.R. Luckey, U.S. Geological Survey.) |
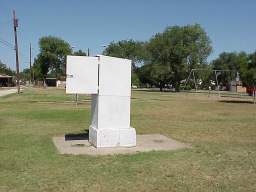
Observation well equipped to measure ground-water levels continually in Lea County, New Mexico (Photograph courtesy of R.R. Cruz, U.S. Geological Survey.) |
![]()
