
|
A CENTURY OF SERVICE-100 YEARS OF CONTINUOUS STREAMFLOW-DATA COLLECTION ON THE CONNECTICUT RIVER, MONTAGUE CITY, MASSACHUSETTSBy Matthew G. Cooke, Roy S. Socolow, and Joseph L. Zanca.USGS Fact Sheet FS-2004-3049 |
In 1904, the U.S. Geological Survey (USGS) began continuous streamflow measurements on the Connecticut River when it established a streamflow-gaging station near Montague City, Massachusetts. Since that time, the USGS has maintained a continuous record of streamflow of the Connecticut River at the Montague City station. From its rudimentary beginnings as a staff gage, to the satellite technology used today, the Montague City station has greatly evolved over its century of service. Researchers and resource managers have used data from this station for a variety of purposes, including monitoring the amount of water released from dams, assessing local and regional water quality, and collecting data related to tracking the movements of fish populations. From this first station grew the current (2004) network of 90 streamflow-gaging stations throughout Massachusetts, 72 of which report real-time flow and water-level data to the World Wide Web. Today, water-resource managers from local, State, and Federal agencies, recreational enthusiasts, watershed associations, private corporations, and university scientists depend upon data from this network to make informed decisions about the use and stewardship of water resources in Massachusetts.
Continuous records of discharge from the 90 streamflow-gaging stations in Massachusetts range from 1 to 100 years (Zarriello and Socolow, 2003). March 31, 2004, marked the centennial anniversary of the continuous record of discharge from the Connecticut River at Montague City station (fig. 1).
To commemorate this event, this Fact Sheet provides an overview of the history of the Montague City station, including a discussion of when it was built, how data were collected, the development of the station over the years, and the station as it is used today. It also briefly discusses how data from the station are used, and presents salient facts about the data collected at the station.
 |
|---|
Figure 1. Location of the Connecticut River streamflow-gaging station at Montague City, Massachusetts. |
In March 1904, the USGS began data collection on the Connecticut River at Sunderland, Massachusetts, 9 miles downstream of the current station location in Montague City, when N.C. Grover of the USGS installed a staff gage on the highway bridge that spanned the river. Twice daily, John Lawer manually read the staff gage, essentially a ruler fixed to a permanent structure in the water body being measured, to determine the river's stage, the elevation of the river's surface relative to a fixed point.
Stage measurements provide only part of the information necessary for determining streamflow. Stream-discharge measurements are also needed to develop a relation between stage and flow. On April 12, 1904, S.K. Clapp made the first discharge measurement at the Sunderland station, recording a discharge of 55,000 cubic feet per second (Barrows and Hoyt, 1905).
The USGS collected stage data at Sunderland with the staff gage until October 1, 1917, when it installed a graphic recorder that continuously traced river stage. The recorder consisted of a pen moved by a float and counterweight, and a clock that advanced the graphic chart on which the pen traced the stage measurements. This recorder was used to record only lower stages. At higher stages, the observer still manually read the staff gage. Data from the Connecticut River were collected with these methods until October 8, 1921. On October 9, 1921, the USGS installed a new graphic recorder capable of recording all ranges of stage (Socolow and others, 2003).
 |
|---|
Figure 2. The Montague City, Massachusetts, streamflow-gaging station, shortly after its construction in October 1929. |
On September 21, 1929, H.B. Kinnison, the District Engineer for the USGS Boston office, received permission from the New York, New Haven, and Hartford Railroad Company to begin construction of a new station on railroad property in the town of Montague. By October 30, 1929, G.K. Wood had completed construction and started operation of the new station (fig. 2) 9 miles upstream from the original station at Sunderland. The new station contained a graphic float-type recorder that recorded stage at all levels. About one-half mile below the station, Wood installed a cableway, a cable spanning the width of the river from which a car was suspended, allowing the USGS scientists to measure flow from a height safely above the river (fig. 3). To ensure that data from the Montague City station were accurate and comparable to data from the Sunderland station, the two stations operated concurrently until September 30, 1932.
 |
|---|
Figure 3. A discharge measurement being made by technicians from a cableway on the Connecticut River at Thompsonville, Connecticut, August 1939. |
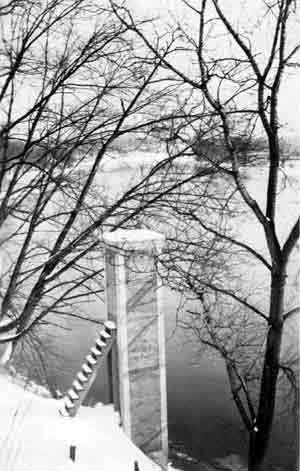
Because of its location on a steep bank that eroded during high flows, the Montague City station suffered structural damage. As early as 1942, station records indicate that the gage house was held upright by a cable attached from a tree to the top of the house (fig. 4). In 1985, the original structure was deemed unsafe and unfit for operation and subsequently abandoned. In that same year, a new station was built just 25 feet upstream from the original house and about 5 feet farther back from the stream bank. Data collection in the new gage house began in the summer of 1985. Use of the cableway continued until May 1994, when it was abandoned as unsafe for operation. It was removed in 2003.
 |
|---|
Figure 4. A photo of the Montague City station under high water, April 6, 1960. Recorded stage was 37.50 feet. |
Today, the Montague City station contains some of the most sophisticated equipment used in stream gaging. Stage is recorded through an automated data-collection system that consists of a nitrogen tank, electronic stage sensor and data recorder, and satellite transmitter. The nitrogen tank pumps a steady flow of nitrogen gas through a tube fixed to the river bottom. As the river's stage changes, pressure inside the tube changes. A pressure transducer measures the pressure and converts it to stage, and a recorder digitally records the measurement. Stage measurements are made and recorded every 15 minutes. At 4-hour intervals, the data are transmitted to a satellite, which then sends updates to the USGS database, and ultimately to the World Wide Web.
To assure that the relation between stage and discharge remains accurate, the USGS also manually measures discharge approximately three times each year, during low, medium, and high flows, at the Montague City station. Since abandonment of the cableway, all such measurements are now made from a boat. During low flows, measurements are made with a mechanical current meter, a device that looks like a wind meter. Medium and high-flow measurements are made with an acoustic doppler current profiler, a device that uses sound waves to measure water velocity.
 |
|---|
Figure 5. A photo of early 20th-century current meters and sounding weights of the type that would have been used to make velocity measurements at Montague City. The current meters featured a rotating-cup wheel that sent an electrical signal in the form of an audible click to a hydrographer, who counted and timed the clicks. From that information, the hydrographer calculated river velocity. Also shown is a cable-operated, water-sampling bottle. |
The USGS presents streamflow information in two ways—river stage and discharge. River stage refers to the height of the water surface above a reference point set at the streamflow-gaging station. Stage refers only to the specific pool where the streamflow data are collected and not to the entire river. Most importantly, stage does not refer to water depth. River depth and discharge can change without corresponding changes in stage. A river can have more or less water flowing in it without a change in stage.
During periods of high flow, for example, a river bottom can scour or erode. If water erodes the rocks and sediment at the location where the river is measured, the channel becomes deeper and wider and the river has more flow, but the stage has not changed. The opposite can happen also. Stage can increase without an increase in flow. For instance, during drought conditions aquatic grasses might grow across the "control," the downstream riffle or channel configuration that controls the stage of the gaged pool. The grasses may dam the water in the pool and force the stage to rise with no corresponding increase in flow.
Discharge, typically measured in cubic feet per second (ft3/s), refers to the actual rate of water flowing through the river. By using discharge as a reference, data users can relate flow conditions at Montague City to other locations on the river.
The USGS develops a mathematical relation between the river's stage and the actual discharge measurements. This mathematical relation, called a rating, is used to determine discharges for all stages recorded at the station. Repeated discharge measurements are needed to verify the existing rating or define a new one, which is why the USGS continues to make discharge measurements at Montague City.
 |
|
| The current rating curve and the first rating curve developed for the Connecticut River at Montague City station. Repeated discharge measurements are needed to verify an existing rating or to define a new one. This graph shows the discharge measurements used in the development of rating curve 1 and selected measurements used to develop rating curve 24. The 23 rating curves developed between 1933 and 2002 have varied between these two curves. | |
Montague Water Facts• Since 1904, 70 different USGS employees have made a total of 353 discharge measurements at the Montague City station.• Since 1960, over 1 million, 15-minute-interval stage recordings have been made at the station. Before 1960, stage was continuously recorded graphically.• The highest recorded flow at the Montague City station was 236,000 cubic feet per second (1,765,000 gallons per second), recorded March 19, 1936. This was enough water to fill two Olympic-size swimming pools every second.• The highest recorded stage, 49.2 feet, was also on March 19, 1936.• The lowest flow ever recorded at the station was 215 cubic feet per second, on August 31 and September 1, 1958.• The drainage area of the Connecticut River at Montague City is 7,860 square miles, and extends into Canada and large portions of eastern Vermont, western New Hampshire, and western Massachusetts. |
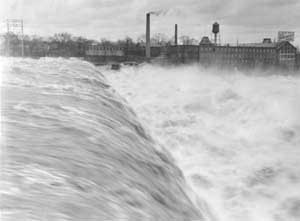
The Connecticut River at the Holyoke Dam, Holyoke, Massachusetts, March 1936. The highest discharge ever recorded at the Montague City station, 236,000 cubic feet per second, and the highest stage, 49.2 feet, were recorded during the flood on March 19 |
|
Because it was close to the confluence of the Deerfield and Connecticut Rivers, the original station at Sunderland was probably installed to monitor flows from the Turners Falls Dam and from reservoirs on the Deerfield River. From this first station grew a network of streamflow-gaging stations throughout Massachusetts. Within 20 years of the start of data collection at Montague City, 12 other stations were installed on rivers throughout Massachusetts, including several stations on tributaries to the Connecticut River. Most likely, these stations were originally installed to monitor water supply for the many mill works and hydroelectric dams operating throughout Massachusetts.
Over the years, various constituencies have used data from the Montague City station. Currently, three agencies—the Massachusetts Water-Resources Authority, Holyoke Gas and Electric, and Pacific Gas and Electric National Energy Group— all have their own systems recording data at the Montague City station. The U.S. Environmental Protection Agency (USEPA) uses data from the station to carry out its responsibilities set forth in the Clean Water Act, such as to calculate flow statistics for several dozen facilities permitted to discharge wastewater into the river under the National Pollutant Discharge Elimina- tion System (R. Abele, U.S. Environmental Protection Agency, written commun., 2003). The U.S. Army Corps of Engineers, Massachusetts Department of Environmental Protection, and the National Weather Service all depend upon data from Montague City as well. In addition to the basic streamflow data used to understand the quantity and timing of streamflow in the Connectiuct River, the USGS has used data from the station for assessments of water quality and has also installed equipment for tracking salmon movements.
The Montague City station is one of over 7,000 streamflow- gaging stations that the USGS maintains throughout the Nation. These stations are funded by a partnership with over 800 local, Federal, State, and tribal agencies (U.S. Geological Survey, 2003). Funding for the Montague City station comes from a cooperative agreement between the USGS and the Massachusetts Department of Conservation and Recreation, Division of Water Supply Protection.
Flow data from the Connecticut River at Montague City station and from 72 other stations throughout Massachusetts are provided on the World Wide Web. For data and more informa- tion about USGS investigations in Massachusetts, visit http://ma.water.usgs.gov/ or call the Massachusetts-Rhode Island District office in Northborough, Massachusetts at 1-508-490-5000.
Prepared by Matthew G. Cooke, Roy S. Socolow, and Joseph L. Zanca. Graphic design by Mark V. Bonito.
This report is presented in Portable Document Format (PDF). To view and print report you will need to have PDF Viewer or Adobe Acrobat Reader (available as freeware). Users with visual disabilities can click here for conversion tools and information to help make PDF files more accessible.
Accessible text version FS2004-3039.txt (13 kilobytes)
Printable PDF version FS2004-3039.pdf (2,279 KB) -- 4 pages
The citation for this report, in USGS format, is as follows:
Cooke, M.G., Socolow, R.S., Zanca, J.L., A Century of Service-100 Years of Continuous Streamflow-Data Collection on the Connecticut River, Montague City, Massachusetts, FS-2004-3049, 4 p.
For more information about USGS activities in Massachusetts-Rhode Island District, visit the USGS Massachusetts-Rhode Island Home Page
| AccessibilityFOIAPrivacyPolicies and Notices | |
 |
|