
Water-Level Changes
in the High Plains Aquifer,
Predevelopment to 2003 and 2002 to 2003
Fact Sheet 2004–3097
—By V.L. McGuire
Available from the U.S. Geological Survey, Branch of Information
Services, Box 25286,
Denver Federal Center, Denver, CO 80225, USGS Fact Sheet 2004-3097.
This document also is available in pdf format:
![]() fs-2004-3097.pdf
(2.1 MB)
fs-2004-3097.pdf
(2.1 MB)
(Requires Adobe
Acrobat Reader)
| The High Plains aquifer underlies one of the major agricultural regions in the world, including parts of eight statesColorado, Kansas, Nebraska, New Mexico, Oklahoma, South Dakota, Texas, and Wyoming. In parts of the area that overlie the High Plains aquifer, farmers began extensive use of ground water for irrigation starting in the 1930s and 1940s. Estimated irrigated acreage in the area that overlies the High Plains aquifer increased rapidly from 1940 to 1980, but did not change greatly from 1980 to 2002:
Water-level declines started to occur in the High Plains aquifer soon after the beginning of extensive ground-water irrigation. The water-level changes in the High Plains aquifer result from an imbalance between discharge and recharge. Discharge is primarily from ground-water withdrawals for irrigation, but also includes evapotranspiration, where the water table is near land surface, and seepage to streams and springs where the water table intersects the land surface. Recharge is primarily from precipitation; other sources of recharge are irrigation return flow and seepage from streams, canals, and reservoirs. By 1980, water levels in the High Plains aquifer in parts of Texas, Oklahoma, and southwestern Kansas had declined more than 100 feet (Luckey and others, 1981). Water-level declines may result in increased costs for ground-water withdrawals because of increased pumping lift and decreased well yields. Water-level declines also can affect ground-water availability, surface-water flow, and near-stream habitat (riparian) areas. In response to the water-level declines in the High Plains aquifer, the U.S. Geological Survey, in cooperation with numerous Federal, State, and local water-resource agencies, began monitoring more than 7,000 wells in 1988 to assess the annual water-level change in the aquifer; there were 9,202 wells
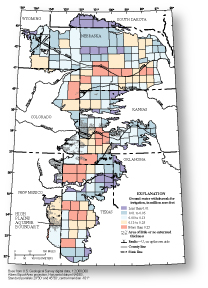
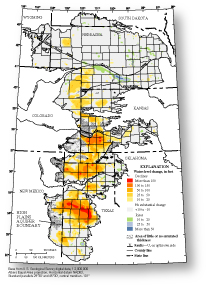
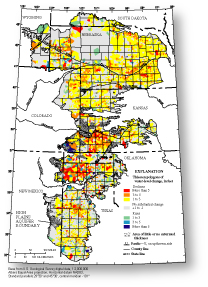
The water-level-change maps and related area-weighted average water-level change values in this report were prepared using two methods. The map of water-level changes, predevelopment to 2003 (fig. 2), shows areas of water-level change ranges, which were determined manually based on predevelopment and 2003 water-level data from available wells and areas of water-level changes from previous reports (Lowry and others, 1967; Luckey and others, 1981; Nebraska Conservation and Survey Division, 2004). The map of generalized water-level changes, 2002 to 2003 (fig. 3), shows computer-generated Thiessen polygons (Thiessen, 1911), colored by the water-level-change range. Thiessen polygons apportion the water-level change in each well to an area around the well; the size of each polygon depends on the proximity of neighboring wells. The predevelopment to 2003 area-weighted average water-level change (table 2) was computed by summing the quantity equal to the area within each polygon of water-level change multiplied by the value of the mid-point of the
WATER-LEVEL CHANGES, PREDEVELOPMENT TO 2003 The map of water-level changes in the High Plains aquifer from predevelopment to 2003 (fig. 2) is based on water levels from 3,792 wells (table 1). The water-level changes from predevelopment to 2003 ranged between a rise of 86 feet and a decline of 223 feet. The area-weighted average water-level change across the High Plains, not including the areas with little or no saturated thickness, was a decline of 12.6 feet (table 2). Approximately 24 percent of the aquifer area, not including the areas with little or no saturated thickness, had more than 10 feet of water-level decline from predevelopment to 2003; 17 percent had more than 25 feet of water-
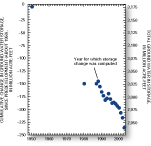
WATER-LEVEL CHANGES, 2002 TO 2003 Water-level changes in the 8,208 wells used for the 2002 to 2003 comparison period (table 1) ranged between a rise of 9 feet and a decline of 14 feet; water-level declines of 3 feet or greater occurred in 19 percent of the wells measured (fig. 3). The area-weighted average water-level change in the High Plains aquifer from 2002 to 2003, not including the areas of little or no saturated thickness, ranged by State from a decline of 1.7 feet in Kansas to a decline of 0.3 foot in Wyoming (table 2). The area-weighted average water-level change in the High Plains aquifer from 2002 to 2003 for the aquifer area, not including the areas of little or no saturated thickness, was a decline of 1.2 feet (table 2). CHANGE IN WATER IN STORAGE, PRE-DEVELOPMENT TO 2003 Because the High Plains aquifer is generally unconfined, the change in water in storage in the High Plains aquifer can be estimated using the water-level change maps (figs. 2 and 3) and the average specific yield of the aquifer (Gutentag and others, 1984). Specific yield is an estimate of the volume of water that a volume of the aquifer will yield by gravity drainage (Lohman, 1979). This method for calculating the change in water in storage will overestimate the change in storage in local areas if the aquifer was under confined conditions at the start of the time period and unconfined conditions later.
Total water in storage in 2003 was about 2,940 million acre-feet, which was a decline of about 235 million acre-feet since predevelopment (fig. 4); total water in storage in 2003 was estimated from total water in storage in 2000, which was based on the saturated thickness of the aquifer in 2000 (McGuire and others, 2003), and the sum of annual changes in water in storage from 2000 to 2003, which was based on average area-weighted water-level changes calculated from Theissen polygons (McGuire, 2003, 2004; table 3). Total water in storage in predevelopment was inferred from total water in storage in 2000 and water-level changes, predevelopment to 2000 (McGuire and others, 2003). There were changes in storage prior to predevelopment, as defined in this report, but this change in storage was not calculatedhere. Water in storage declined about 150 million acre-feet from predevelopment to 1980 based on predevelopment and 1980 water levels (Luckey and others, 1981; McGuire, 2004); the annual change in storage from predevelopment to 1980 and from 1981 to 1987 were not calculated for this report. For this report, total ground water in storage from 1988 to 2000 (fig. 4) was calculated by subtracting annual changes in water in storage, 1988 to 2000, from total water in storage in 2000 (Dugan and Cox, 1994; Dugan and others, 1990, 1994; Dugan and Schild, 1992; Dugan and Sharpe, 1996; Kastner and others, 1989; McGrath and Dugan, 1993; McGuire, 2001, 2003; McGuire and Fischer, 1999, 2000; McGuire and others, 1999, 2003; McGuire and Sharpe, 1997). The sum of annual changes in water in storage from 1988 to 2000 was a decline of about 47 million acre-feet, based on average area-weighted water-level changes calculated from Thiessen polygons.
REFERENCES Dugan, J.T., and Cox, D.A., 1994, Water-level changes in the High Plains aquiferPredevelopment to 1993: U.S. Geological Survey Water-Resources Investigations Report 944157, 60 p. Dugan, J.T., McGrath, T.S., and Zelt, R.B., 1994, Water-level changes in the High Plains aquiferPredevelopment to 1992: U.S. Geological Survey Water-Resources Investigations Report 944027, 56 p. Dugan, J.T., and Schild, D.E., 1992, Water-level changes in the High Plains aquiferPredevelopment to 1990: U.S. Geological Survey Water-Resources Investigations Report 914165, 55 p. Dugan, J.T., Schild, D.E., and Kastner, W.M., 1990, Water-level changes in the High Plains aquifer underlying parts of South Dakota, Wyoming, Nebraska, Colorado, Kansas, New Mexico, Oklahoma, and TexasPredevelopment through nonirrigation season 1988-89: U.S. Geological Survey Water-Resources Investigations Report 904153, 29 p. Dugan, J.T., and Sharpe, J.B., 1996, Water-level changes in the High Plains aquiferPredevelopment to 1994: U.S. Geological Survey Water-Resources Investigations Report 954208, 1 sheet. Gutentag, E.D., Heimes, F.J., Krothe, N.C., Luckey, R.R., and Weeks, J.B., 1984, Geohydrology of the High Plains aquifer in parts of Colorado, Kansas, Nebraska, New Mexico, Oklahoma, South Dakota, Texas, and Wyoming: U.S. Geological Survey Professional Paper 1400B, 63 p. Heimes, F.J., and Luckey, R.R., 1982, Method for estimating irrigation requirements from ground water in the High Plains in parts of Colorado, Kansas, Nebraska, New Mexico, Oklahoma, South Dakota, Texas, and Wyoming: U.S. Geological Survey Water-Resources Investigations Report 8240, 64 p. Kastner, W.M., Schild, D.E., and Spahr, D.S., 1989, Water-level changes in the High Plains Aquifer underlying parts of South Dakota, Wyoming, Nebraska, Colorado, Kansas, New Mexico, Oklahoma, and Texaspredevelopment through nonirrigation season 1987-88: U.S. Geological Survey Water-Resources Investigations Report 894073, 61 p. Lohman, S.W., 1979, Ground-water hydraulics: U.S. Geological Survey Professional Paper 708, 70 p. Lowry, M.E., Crist, M.A., and Tilstra, J.R.,1967, Geology and ground-water resources of Laramie County, Wyoming; with a section on chemical quality of ground water and of surface water: U.S. Geological Survey Water-Supply Paper 1834, 71 p. Luckey, R.R., Gutentag, E.D., and Weeks, J.B., 1981, Water-level and saturated-thickness changes, predevelopment to 1980, in the High Plains aquifer in parts of Colorado, Kansas, Nebraska, New Mexico, Oklahoma, South Dakota, Texas, and Wyoming: U.S. Geological Survey Hydrologic Investigations Atlas HA652, 2 sheets, scale 1:2,500,000. McGrath, T., and Dugan, J.T., 1993, Water-level changes in the High Plains Aquiferpredevelopment to 1991: U.S. Geological Survey Water-Resources Investigations Report 934088, 53 p. McGuire, V.L., 2001, Water-level changes in the High Plains Aquifer, 19801999: U.S. Geological Survey Fact Sheet FS-002901, 2 p. McGuire, V.L., 2003, Water-level changes in the High Plains aquifer, predevelopment to 2001, 1999 to 2000, and 2000 to 2001: U.S. Geological Survey Fact Sheet FS-078-03, 4 p. McGuire, V.L., 2004, Water-level changes in the High Plains aquifer, predevelopment to 2002, 1980 to 2002, and 2001 to 2002: U.S. Geological Survey Fact Sheet FS-20043026, 6 p. McGuire, V.L., and Fischer, B.C., 2000, Water-level changes in the High Plains, 1980 to 1998: U.S. Geological Survey, accessed August 26, 2004 at URL http://www-ne.cr.usgs.gov/highplains/hp98_web_report/hp98fs.htm. McGuire, V.L., and Fischer, B.C., 1999, Water-level changes, 1980 to 1997, and saturated thickness 199697, in the High Plains Aquifer: U.S. Geological Survey Fact Sheet FS-12499, 4 p. McGuire, V.L., Johnson, M.R., Schieffer, R.L., Stanton, J.S., Sebree, S.K., and Verstraeten, I.M., 2003, Water in storage and approaches to ground-water management, High Plains aquifer, 2000: U.S. Geological Survey Circular 1243, 51 p. McGuire, V.L., and Sharpe, J.B., 1997, Water-level changes in the High Plains Aquifer, 1980 to 1995: U.S. Geological Survey Fact Sheet FS-006897, 4 p. McGuire, V.L., Stanton, C.P. and Fischer, B.C., 1999, Water-level changes in the High Plains aquifer1980 to 1996: U.S. Geological Survey, accessed August 26, 2004, at URL http://ne.water.usgs.gov/html/highplains/hp96_web_report/hp96_factsheet.htm. Nebraska Conservation and Survey Division, 2004, Groundwater-level changes in Nebraska from predevelopment to spring 2003: University of NebraskaLincoln data, accessed July 11, 2004 at URL http://csd.unl.edu/csd-esic/gisdata/pred03z14.e00. Thiessen, A.H., 1911, Precipitation averages for large areas: Monthly Weather Review, v. 39, p. 10821084. Thelin, G.P., and Heimes, F.J., 1987, Mapping irrigated cropland from Landsat data for determination of water use from the High Plains aquifer in parts of Colorado, Kansas, Nebraska, New Mexico, Oklahoma, South Dakota, Texas, and Wyoming: U.S. Geological Survey Professional Paper 1400C, 38 p. U.S. Department of Agriculture, 1999, 1997 Census of agriculture geographic area series: National Agricultural Statistics Service CD-ROM AC97-CD-VOL1-1B. U.S. Department of Agriculture, 2004, Census of agriculture, volume 1, County level data: National Agriculture Statistics Service, accessed July 13, 2004 at URL http://www.nass.usda.gov/census/census02/volume1/index2.htm. U.S. Geological Survey, 2004, Water Use in the United States: U.S. Geological Survey data, accessed July 29, 2004 at URL http://water.usgs.gov/watuse/. |
| For additional
information contact: U.S. Geological Survey Federal Bldg., Room 406 100 Centennial Mall North Lincoln, NE 68508 (402) 4375082 USGS Nebraska District home page: http://ne.water.usgs.gov |
![]()
