
Fact Sheet 2004–3123
November 2004
The Everglades is a vast subtropical ecosystem on the southern tip of the Florida peninsula that is the subject of an extensive restoration effort. A major objective of Everglades restoration, as defined in the Comprehensive Everglades Restoration Plan (CERP) (http://www.evergladesplan.org/), is to restore the ecosystem to more natural predrainage conditions. This effort not only requires scientific insight into factors that affect flow behavior for effective restoration planning but also requires background knowledge of flow conditions for restoration assessment, identified as a critical need in the CERP Monitoring and Assessment Plan (http://www.evergladesplan.org/pm/recover/recover_map_2004.cfm). Knowledge of flow conditions also is vital to the development and use of models to evaluate, interpret, and compare restoration scenarios for implementation of the CERP. Moreover, the role of flow as a factor contributing to landscape changes in the Everglades is not well understood and needs to be investigated (National Research Council, 2003). In general, the Science Coordination Team of the South Florida Ecosystem Restoration Task Force (http://www.sfrestore.org/) has asserted that there is an urgent need for flow research in the Everglades to increase the level of understanding and awareness of its role in restoration activities (Science Coordination Team, 2003).
The freshwater wetlands of the Everglades are a mosaic of tree islands, sawgrass marshes, wet prairies, and sloughs. Flow typically is shallow and slow in the wetlands. The shallow-depth, slow-velocity flow, referred to as sheet flow, is controlled primarily by the small topographic gradient (~10-6), the high internal resistance of submerged aquatic plants and emergent vegetation, and to a lesser extent by water levels, microtopography, and meteorological factors. Sheet-flow conditions are vital to habitat sustainability. Strong but mostly anecdotal evidence suggests that sheet flow helps shape and preserve the ridge and slough landscape (Science Coordination Team, 2003). Drainage and compartmentalization coupled with decades of managed water controls have altered sheet-flow conditions in the Everglades.
Significant portions of the Everglades have been compartmentalized with the largest remaining free-flowing part being within Everglades National Park (ENP). Shark River Slough (fig. 1) is a prominent drainage feature in ENP that conveys freshwater inflows to the coastal mangrove ecotone as sheet flow through vegetated wetlands. In a recently completed study by the U.S. Geological Survey (USGS), sets of continuous flow-velocity, water-temperature, and conductivity data were collected in Shark River Slough during wet seasons from July 1999 to July 2003. The Everglades wet season typically coincides with the June through November tropical hurricane season. These flow data, documented in Riscassi and Schaffranek (2002, 2003, and 2004), define the range of flow velocities in a variety of vegetative communities and are yielding insight into factors that influence the sheet-flow regime. A summary of the data and an overview of study findings are presented in this Fact Sheet.
Figure 1. Satellite image showing monitoring sites in southern Florida.
Over the course of the study, flow velocities, water and air temperatures, and (or) conductivities were measured at five sites with different vegetative properties. Locations of the five monitoring sites are shown in figure 1. At four sites (SH1, GS-203, GS-33, and GS-36), flow velocities were measured at a fixed elevation in the water column using acoustic Doppler velocity (ADV) meters. At three sites (GS-203, GS-33, and GS-36), conductivities were measured at a fixed elevation near the top of the plant litter layer. At all five sites, temperatures were monitored in the plant litter, at vertical intervals throughout the water column, on the water surface, and in the air above the water column using thermally sensitive resistors. In addition to considerations of vegetation characteristics and regional location, monitoring sites were selected based on their proximity to existing hydrologic and meteorological stations.
Photographs of vegetation at the four sites where flow velocities were measured are shown in figure 2. Site SH1 (fig. 2A) is a medium-dense area of spikerush (Eleocharis cellulosa) on the edge of a sawgrass (Cladium jamaicense) stand. Site GS-203 (fig. 2B) is a medium-dense area of sawgrass on the edge of a dense sawgrass stand. Sites GS-33 (fig. 2C) and GS-36 (fig. 2D) are sparse and medium-dense spikerush areas, respectively, each having various amounts of submerged aquatic vegetation and periphyton. Periphyton, a matrix of algae found on the top of the litter layer, floating, submerged, or attached to plant stems in various concentrations at all sites, can be seen in mats floating near the water surface at site GS-36 in figure 2D. Un-pictured site NP202 (fig. 1) is a dense cattail (Typha domingensis) area. Dates for which valid velocity, temperature, and conductivity data were collected, typically bihourly, are identified in figure 3.
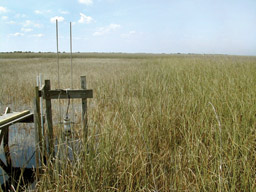

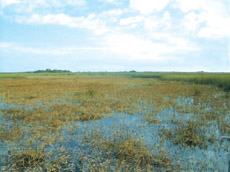
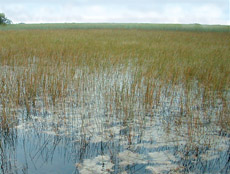
Figure 2. Vegetation at flow-monitoring sites (A) SH1, (B) GS-203, (C) GS-33, and (D) GS-36.
Figure 3. Dates of processed and edited flow-velocity, conductivity, and temperature data.
ADV meters measure the frequency shift between a transmitted acoustic pulse and its reflectance from particulate matter within a small sample volume (0.25 cm3) to determine flow velocity. An ADV meter is shown suspended vertically from a horizontal board and centered between two vertical boards at the SH1 site in figure 2A. The ADV meter senses and records three-dimensional velocity components to an accuracy of ±1 % of the measured velocity (SonTek, 2001) with a resolution of 0.01 cm/s. Because vertical velocity components are negligible, only horizontal velocity components were used to determine flow speeds and directions. A sample plot of velocity vectors showing bihourly flow speeds and directions at site GS-203 during the 2000-2001 wet season is presented in figure 4.
ADV data collected at four sites indicate a range of sheet-flow velocities in typical vegetative communities within ENP. The daily means of all ADV data ranged between 0.20 and 5.16 cm/s, with an overall mean of 1.15 cm/s (Riscassi and Schaffranek, 2002, 2003, and 2004). Ninety percent of all daily mean flow velocities were between 0.46 and 2.29 cm/s. Mean flow velocities were 1.63, 0.82, 0.68, and 1.40 cm/s at directions of 225, 243, 200, and 229 degrees from magnetic north for all data collected at sites SH1, GS-203, GS-33, and GS-36, respectively. These mean flow velocities, although representative of sheet-flow conditions in similarly vegetated areas within ENP, should not be assumed to be typical of flow in compartmentalized regions of the Everglades, such as Water Conservation Areas (WCA).
Inhomogeneity in the speed, direction, and behavior of sheet flow is a function of external and internal forcing mechanisms, both locally and regionally driven. Local factors include water depth; microtopography; the type, amount, and properties of emergent vegetation; and the presence, density, and composition of submerged aquatic plants and (or) periphyton. Regional factors include the water-surface slope; land-surface gradient; vegetative heterogeneity; and the proximity of tree islands, airboat trails, hydraulic structures, roads, culverts, canals, and levees. Meteorological factors such as winds variously and intermittently affect flow conditions. Fires also have a residual effect on sheet-flow behavior (Schaffranek and others, 2003). Several factors affecting sheet-flow conditions are discussed in the following sections.
Data indicate that dynamic variability in flow directions is most evident during low water levels and is considerably damped with increased water depth. Implications are that when water levels are high, regional factors drive flow more uniformly; however, as water levels fall, flow velocities decrease, momentum is reduced, and the flow becomes more susceptible to local forcing mechanisms, such as microtopography and vegetative properties. A graph of flow speed plotted against direction for bihourly velocity data collected at site GS-203 during the 2000-2001 wet season is shown in figure 5. Flow velocities greater than about 0.5 cm/s are more consistent in direction than flow at slower velocities. The standard deviation in flow direction of velocities greater than 0.5 cm/s is less than a third of the standard deviation of flow velocities less than 0.5 cm/s. Near-convergence of flow velocities to a constant direction at faster speeds is clearly evident in figure 5. Analyses of velocity data in conjunction with water levels recorded at a nearby hydrologic monitoring station revealed that the most significant velocity fluctuations occurred during low water depths (see fig. 4). It is likely that flow velocities and sheet-flow conditions in WCA of the Everglades behave similarly to the slow (< 0.5 cm/s) velocity data plotted in figure 5 at nearly all flow depths. However, this hypothesis needs to be tested through concurrent acquisition of synoptic time-series of flow data in wetlands of both ENP and WCA.
Figure 5. Bihourly flow speeds and directions at site GS-203 during 2000-2001 wet season.
The vertical flow structure at all ADV sites was fairly uniform, with variations in flow speed and direction corresponding to differences in vegetation composition. Flow velocities at 3-cm depth intervals and volumes of organic material, primarily spikerush and periphyton, occupying the water column at 10-cm depth increments are shown in figure 6 for site GS-33. The reduced flow velocity near the water surface is due to the presence of periphyton, which was concentrated in mats floating near the water surface. At about 10 cm above the plant litter layer the flow speed begins to decline to zero velocity at the top of the litter layer. Vertical velocity profiles at each of the ADV monitoring sites revealed similar damped flow speeds within about 5-10 cm above the plant litter layer. Relatively uniform flow structure was observed throughout the middle to upper part of the water column for uniform vegetation composition. The flow speed and direction measured by the self-recording ADV meter deployed at the site are plotted at its sampling depth in figure 6 to show the close agreement of the two independent velocity measurements.
Intermittent storm and rainfall events appeared to have limited, mainly local, influence on flow behavior, but these effects varied greatly depending not only on the amount of submerged vegetation but also on the amount of emergent vegetation sheltering the water surface from wind effects. In general, the relatively deep sample depths of the ADV meters inhibited detection and assessment of the strength of meteorological effects, which tend to be damped with increased distance from the water surface. Some flow data suggested that strong storms affected vegetation composition, which in turn had residual effects on flow behavior, but these effects only persisted for a few days. The regional extent of storm effects on sheet-flow behavior could not be evaluated with any degree of confidence given the limited amount of data and few monitoring stations. Temperature-profile data indicate, however, that persistently strong winds, rainfall events, or cool cloud-covered days have atypical thermal effects on internal flow structure.
Concurrent temperature-profile and flow-velocity data collected at each of four sites have documented thermal effects on internal flow structure. Temperature profiles collected at 5- and 10-cm depth intervals link large fluctuations in flow velocities measured and recorded after sunset to thermal convection (Jenter and others, 2003). Temperature data indicate that the water column is typically isothermal at the beginning of each day, stratifies during the daytime, and de-stratifies during the night due to mixing driven by thermal convection. This mixing process has potentially profound implications on understanding processes of importance to successful implementation of the CERP, including mercury methylation, evapotranspiration, oxidation, and nutrient cycling.
A study of sheet flow in ENP from July 1999 to July 2003 has produced data defining flow velocities in varied vegetative communities and yielded insight into factors that affect flow behavior of importance to Everglades restoration. The mean of all daily mean flow velocities for the four sites was 1.15 cm/s. Ninety percent of all daily mean flow velocities were between 0.46 and 2.29 cm/s. Mean flow directions at all sites were southwesterly ranging between 200 and 243 degrees relative to magnetic north. Flows at velocities greater than 0.5 cm/s were more consistent in direction than flows at slower velocities. Vertical flow structure was fairly uniform and correlated to vegetation composition. Meteorological effects on flow were limited mainly to significant storm events, although data limitations precluded more definitive analyses. Thermal-driven vertical mixing was documented to occur nearly daily in the absence of storm events and passage of weather fronts. More such flow data would be desirable to define and evaluate sheet-flow conditions in other areas of ENP and in other regions of the Everglades to aid restoration efforts. Comparable flow data in WCA would enable comparison of sheet-flow behavior in compartmentalized regions with free-flowing conditions in ENP and provide a means to assess the role of flow in shaping and preserving the Everglades landscape.
Support for this study was provided by the USGS Priority Ecosystems Science Initiative. Nancy Rybicki and Alfonso Lombana, USGS, provided assessments of vegetative properties at the monitoring sites.
Jenter, H.L., Schaffranek, R.W., and Smith, T.J., 2003, Thermally driven vertical mixing in the Everglades, Joint Conference on the Science and Restoration of the Greater Everglades and Florida Bay, Palm Harbor, FL, April 13-18, 2003, pp 290-292, accessed November 3, 2004 at http://sofia.usgs.gov/projects/vege_resist/vertmix_geer03abs.html
National Research Council, 2003, Does water flow influence Everglades landscape patterns, Washington, D.C., The National Academies Press, 41 p, accessed November 3, 2004 at http://books.nap.edu/catalog/10758.html
Riscassi, A.L., and Schaffranek, R.W., 2002, Flow velocity, water temperature, and conductivity in Shark River Slough, Everglades National Park, Florida: July 1999 – August 2001, U.S. Geological Survey Open-File Report 02-159, 32 p.
Riscassi, A.L., and Schaffranek, R.W., 2003, Flow velocity, water temperature, and conductivity in Shark River Slough, Everglades National Park, Florida: August 2001 – June 2002, U.S. Geological Survey Open-File Report 03-348, 37 p.
Riscassi, A.L., and Schaffranek, R.W., 2004, Flow velocity, water temperature, and conductivity in Shark River Slough, Everglades National Park, Florida: June 2002 – July 2003, U.S. Geological Survey Open-File Report 04-1233, 56 p.
Schaffranek, R.W., Riscassi, A.L., Rybicki, N.B., and Lombana, A.V., 2003, Fire effects on flow in vegetated wetlands of the Everglades, Joint Conference on the Science and Restoration of the Greater Everglades and Florida Bay, Palm Harbor, FL, April 13-18, 2003, pp 470-472, accessed November 3, 2004 at http://sofia.usgs.gov/projects/dynamics/fireeffects_03geerab.html
Science Coordination Team, 2003, The role of flow in the Everglades ridge and slough landscape, South Florida Ecosystem Restoration Working Group, 62 p, accessed November 3, 2004 at http://www.sfrestore.org/sct/docs/.
SonTek, 2001, SonTek ADV acoustic Doppler velocimeter technical documentation: San Diego, CA, 202 p.
For more information contact:
Raymond W. Schaffranek
U.S. Geological Survey
12201 Sunrise Valley Drive
National Center, Mail Stop 430
Reston, VA 20192
(703) 648-5891 (voice)
(703) 648-5484 (fax)
rws@usgs.gov (E-mail)
Any use of trade, product, or firm names in this publication is for descriptive purposes only and does not imply endorsement by the U.S. Government.
Document Accessibility: Adobe Systems Incorporated has information about PDFs and the visually impaired. This information provides tools to help make PDF files accessible. These tools convert Adobe PDF documents into HTML or ASCII text, which then can be read by a number of common screen-reading programs that synthesize text as audible speech. In addition, an accessible version of Acrobat Reader 6.0, which contains support for screen readers, is available. These tools and the accessible reader may be obtained free from Adobe at Adobe Access.
| AccessibilityFOIAPrivacyPolicies and Notices | |
 |
|