Link to USGS home page

Floods of November 1996 through January 1997 in the Umpqua River Basin, Oregon

By John C. Risley

U.S. Geological Survey Fact Sheet 2004-3134

Prepared in cooperation with the USDA Forest Service, the Bureau of Land Management,
and the Oregon Water Resources Department


Printed copies of this Fact Sheet are available from the U.S. Geological Survey,
10615 SE Cherry Blossom Dr., Portland, OR 97216. E-mail info-or@usgs.gov,
phone (503) 251-3201. Request USGS Fact Sheet 2004-3134.

This document is also available as a PDF file (0.7 MB), which gives better results
when printing the report. (Requires Adobe Reader®. Download the free reader from
Adobe Systems, Inc.)


Background

During November 1996 through January 1997, a series of storms caused flooding throughout southeastern Oregon, northern California, and parts of Nevada. In Oregon's Umpqua River Basin (fig. 1), the most significant flooding occurred on November 18-19, December 4-9, and January 1-2. The combination of heavy rains, snowmelt, saturated soils, and flooding also resulted in debris flows and landslides. Four people were killed by a debris flow on November 18, 1996, near Rock Creek, a tributary to Hubbard Creek near Millwood. Over the 3-month period, flooding and land disturbances caused over $11 million in damage to public and private property within the Umpqua River drainage basin (Mikeal Jones, U.S. Forest Service, Umpqua National Forest, Roseburg, Oregon, written commun., 2004; Lowell Duell, U.S. Bureau of Land Management (BLM), Roseburg District, Roseburg, Oregon, written commun., 2004; Wayne Stinson, Douglas County, Sheriff's Office, Roseburg, Oregon, written commun., 2004). The Umpqua National Forest and Oregon State highways within Douglas County incurred over $4 million and $3 million in damage, respectively. Damage to BLM lands, local municipal infrastructure, and private property were each over $1 million.

Map of Umpqua Basin showing discharge at streamflow gaging stations during 1996-1997 floods

Figure 1. Map showing the locations of selected stream-gaging and meteorological stations in the Umpqua River Basin, Oregon. (Stream-gaging-station site numbers refer to table 2.)

November Floods

Flooding on November 18-19 was caused by heavy rains that fell on many locations throughout the Umpqua River Basin (table 1). The rains resulted from the convergence of a broad upper-air weather system of moist subtropical air, which originated over the tropical Pacific, and a cold-air mass over Washington (fig. 2). Roseburg received a record 4.35 inches of rainfall in a single day, which surpassed the previous record of 3.28 inches set in 1965. Prior to the storm, soil moisture and precipitation levels throughout the basin were already above average. October 1996 precipitation amounts at Drain, Roseburg, Riddle, and Toketee Falls were 178-215 percent of average.

Most of the precipitation during the period of November 17-19 was rainfall. Air temperature and snowpack data collected at the King Mountain and Diamond Lake snow telemetry (SNOTEL) stations indicated that there was no significant snow accumulation. These stations, operated by the U.S. Department of Agriculture Natural Resources Conservation Service, are located at 4,000 and 5,200 feet elevation, respectively. Because the storm event occurred prior to the winter season and there was no preexisting snowpack at either of these two stations, snowmelt did not provide a significant contribution to the flooding.

Although precipitation from the November 17-19 storm was broadly distributed over the entire Umpqua River Basin, flooding in the North Umpqua River Basin was more severe than flooding in the South Umpqua River Basin (table 2), possibly due to differing antecedent conditions. The recurrence interval for the November peak discharges within the entire basin ranged from less than 2 years to more than 50 years. A 50-year flood has a magnitude that would be expected to occur every 50 years, on average. Such a flood has a 2 percent chance of being equalled or exceed in any given year. The November flood for Boulder Creek near Toketee Falls (14316495) had an unusually high magnitude in comparison to the other basins. The event had a greater than 50-year recurrence and a unit discharge of 372 cubic feet per second per square mile.

Table 1: Daily precipitation, in inches, for principal storms from November 1996 through January 1997 at selected locations, Umpqua River Basin, Oregon.

  Drain1 Roseburg1 Riddle1 Toketee Falls1 King Mountain2 Diamond Lake2
Elevation (feet) 290 420 680 2,060 4,000 5,200
Latitude 43 40 00 43 13 00 42 57 00 43 17 00 42 43 00 43 11 00
Longitude 123 19 00 123 22 00 123 21 00 122 27 00 123 12 00 122 08 00
November 1996 Floods
11/16/1996 0.21 0.06 0.09 0.2 0 0.2
11/17/1996 0.33 0.13 0.02 0.04 0.5 0.4
11/18/1996 1.59 1.8 0.87 5.11 5.8 7.5
11/19/1996 5.92 4.35 2.3 2.01 2.4 2
December 1996 Floods
12/3/1996 0.49 0.53 0.31 0.17 0.3 0.5
12/4/1996 0.06 0.03 0.02 1.8 2.2 2.5
12/5/1996 2.22 1.97 1.39 0.89 0.3 0.9
12/6/1996 0.64 0.82 0.88 0.65 0.5 0.9
12/7/1996 0.61 0.23 0.17 1.03 3.3 1.6
12/8/1996 2.3 3.53 2.75 2.19 4.2 1.6
12/9/1996 0.97 1.57 2.02 0.87 1.2 1.2
January 1997 Floods
12/28/1996 0.18 0.03 0.14 0.65 1.3 1
12/29/1996 0.92 0.62 0.81 1.37 2.2 1.2
12/30/1996 1.09 0.18 0.94 1.18 2.8 2
12/31/1996 1.22 0.85 1.34 0.81 3 1.6
1/1/1997 1.14 1.01 1.51 2.4 3.4 2.6
1/2/1997 0.66 0.4 0.73 0.97 1.2 1.3
1/29/1997 0.01 0.02 0 0 0.3 0.2
1/30/1997 0 0 0.02 0.73 0 1.1
1/31/1997 1.63 0.05 0.3 1.33 0.9 1.3
 
1Source: Oregon Climate Service, Corvallis, Oregon
2Source: U.S. Department of Agriculture, Natural Resources Conservation Service, Portland, Oregon.

Infrared satellite photograph for November 18, 1996, showing subtropical jet stream bringing moisture from the southwest, and a cold air mass over Washington.

Figure 2. Infrared satellite photograph for November 18, 1996, showing subtropical jet stream bringing moisture from the southwest, and a cold air mass over Washington. (Photograph courtesy of the Oregon Climate Service, Corvallis, Oregon).


Table 2. Peak discharge, peak stage, and recurrence intervals for November 1996-January 1997 floods at selected sites, Umpqua River Basin, Oregon.

[Abbreviation and symbol: no. number; fig., figure; mi2, square miles; ft3/s, cubic feet per second; flood events in red print are the annual peaks for water year 1997]

Map no. (fig. 1) USGS station number Station name Drainage area (mi2) Flood frequency period of record November 1996 Flood Map no. (fig. 1) December 1996 Floods Map no. (fig. 1) January 1997 Floods 100-year peak discharge (ft3/s) Largest recorded historical flood peak
Date Peak discharge (ft3/s) Peak stage (ft) Recurrence interval (years) Date Peak discharge (ft3/s) Peak stage (ft) Recurrence interval (years) Date Peak discharge (ft3/s) Peak stage (ft) Recurrence interval (years) Date Magnitude (ft3/s)
1 14308000 South Umpqua River at Tiller 449 1911, 1940-2002 111/18/1996 146,000 122.17 1>25 1 12/4/1996 27,500 17.2 <5 1 1/1/1997 31,700 18.45 <10 58,890 12/22/1964 60,200
2 14308500 Elk Creek near Drew 54.4 1955-1982; 1987-2002 11/18/1996 4,810 8.8 <5 2 12/8/1996 5,000 9.02 >5 2 11/1/1997 18,550 110.87 1<25 13,310 1/9/1995 9,120
3 14308685 Days Creek above May Creek near Days Creek 13 1985-2002 11/18/1996 1,610 3.79 <25 3 112/8/1996 11,730 13.88 1<25 3 1/1/1997 691 2.84 <5 3,118 12/8/1996 1,730
4 14308990 Cow Creek above Galesville Reservoir near Azalea 64.7 1986-2002 11/18/1996 3,010 7.81 <5 4 12/8/1996 4,900 10.01 <10 4 11/1/1997 16,130 111.25 1<25 10,070 1/9/1995 6,980
5 14309000 Cow Creek near Azalea2 78 1928-1931, 1933-1985 ( 3 ) ( 3 ) ( 3 ) ( 3 ) 5 ( 3 ) ( 3) ( 3 ) ( 3 ) 5 11/2/1997 12,490 19.69 1<2 10,920 1/15/1974 10,600
6 14309220 Cow Creek below McCollough Creek near Glendale4 195.1 1986-2002 11/18/1996 2,160 7.68 <2 6 12/8/1996 7,560 14.56 >10 6 11/1/1997 17,870 114.87 1>10 15,060 1/9/1995 7,970
7 14309500 West Fork Cow Creek near Glendale 86.9 1956-2002 111/18/1996 18,560 113.2 1<5 7 ( 3 ) ( 3 ) ( 3 ) ( 3 ) 7 ( 3 ) ( 3 ) ( 3 ) ( 3 ) 15,540 12/22/1964 15,700
8 14310000 Cow Creek near Riddle 456 1955-2002 ( 3 ) ( 3 ) ( 3 ) ( 3 ) 8 112/8/1996 127,400 122.52 1>5 8 ( 3 ) ( 3 ) ( 3 ) ( 3 ) 52,150 1/15/1974 38,400
9 14311200 Olalla Creek near Tenmile5 61.3 1980-2002 11/18/1996 1,810 5.45 <2 9 112/8/1996 16,780 19.24 1<25 9 1/1/1997 2,350 6.45 >2 11,630 2/18/1983 6,970
10 14311500 Lookingglass Creek at Brockway 158 1956-2002 ( 3 ) ( 3 ) ( 3 ) ( 3 ) 10 112/8/1996 111,300 115.72 1<5 10 ( 3 ) ( 3 ) ( 3 ) ( 3 ) 35,370 12/26/1955 35,000
11 14312000 South Umpqua River near Brockway 1,670 1906-1912; 1924-1927; 1942-2002 11/19/1996 60,500 24.63 <5 11 112/8/1996 176,300 128.46 1>5 11 1/1/1997 64,500 25.48 <5 127,200 12/23/1964 125,000
12 14312170 South Fork Deer Creek near Dixonville 15.2 1990-2000 111/18/1996 11,720 16.84 1<10 12 12/8/1996 1,460 6.33 >5 12 ( 3 ) ( 3 ) ( 3 ) ( 3 ) 5,008 1/20/1996 1,910
13 14314500 Clearwater River above Trap Creek near Toketee Falls6 41.6 1928-2002 ( 3 ) ( 3 ) ( 3 ) ( 3 ) 13 ( 3 ) ( 3 ) ( 3 ) ( 3 ) 13 11/1/1997 1968 16.92 1>100 824 12/23/1964 1,020
14 14316000 Fish Creek at Big Fish Ranger Station near Toketee Falls7 68.8 1948-1955; 1957-2002 111/18/1996 16,390 110.66 1<25 14 ( 3 ) ( 3 ) ( 3 ) ( 3 ) 14 ( 3 ) ( 3 ) ( 3 ) ( 3 ) 10,350 12/22/1964 12,100
15 14316495 Boulder Creek near Toketee Falls 30.4 1987-1993; 1995-2002 111/18/1996 111,300 19.78 1>50 15 ( 3 ) ( 3 ) ( 3 ) ( 3 ) 15 ( 3 ) ( 3 ) ( 3 ) ( 3 ) 13,010 11/18/1996 11,300
16 14316500 North Umpqua above Copeland Creek near Toketee Falls 475 1950-2002 111/18/1996 117,200 114.56 1>10 16 ( 3 ) ( 3 ) ( 3 ) ( 3 ) 16 ( 3 ) ( 3 ) ( 3 ) ( 3 ) 34,380 12/22/1964 40,700
17 14316700 Steamboat Creek near Glide 227 1956-2002 111/18/1996 131,400 119.54 1<25 17 12/8/1996 14,700 11.78 >2 17 1/1/1997 13,100 10.98 <2 40,910 12/22/1964 51,000
18 14317600 Rock Creek near Glide 97.4 1957-1973; 1981-2002 111/18/1996 113,200 112.79 1>10 18 12/4/1996 7,130 9.74 >2 18 1/31/1997 3,860 7.47 <2 18,630 12/22/1964 22,800
19 14319500 North Umpqua River at Winchester8 1,344 1909-1913; 1924-1929; 1954-2002 111/19/1996 190,000 127.6 1>10 19 12/8/1996 60,200 20.61 <5 19 1/1/1997 50,500 18.1 >2 129,400 12/22/1964 150,000
20 14319850 Gassy Creek near Nonpareil 9.19 1989-2000 111/18/1996 11,940 16.59 1<25 20 12/8/1996 656 4.4 >2 20 ( 3 ) ( 3 ) ( 3 ) ( 3 ) 3,032 11/18/1996 1,940
21 14320700 Calapooya Creek near Oakland 210 1956-1980; 1987-2001 111/18/1996 127,100 121.62 1>25 21 12/8/1996 12,400 18.42 >2 21 1/1/1997 6,390 13.13 <2 34,980 11/18/1996 27,100
22 14321000 Umpqua River near Elkton 3,683 1906; 1908-2002 11/19/1996 162,000 38.41 <10 22 112/9/1996 1169,000 139.42 1>10 22 1/1/1997 127,000 33.14 <5 254,300 12/23/1964 265,000
23 14321400 Elk Creek near Elkhead 28.7 1987-1999 111/18/1996 16,670 110.82 1<50 23 12/8/1996 2,420 7.79 <5 23 1/1/1997 945 5.86 <2 8,409 11/18/1996 6,670
24 14323085 Smith River near Drain 22.74 1981-1984; 1986-1989; 1992-2002 111/19/1996 11,750 110.67 1>5 24 12/4/1996 1,110 7.47 >2 24 1/31/1997 995 6.89 <2 2,987 12/6/1981 2,040
 

1 Flood events are the annual peaks for water year 1997.
2 Water years 1986-2002 not used in frequency analysis due to Galesville Reservoir regulation.
3 Months with no data did not have flood events.
4 Site is partially affected by Galesville Reservoir regulation.

5 Site is partially affected by Ben Irving Reservoir regulation.
6 200 ft3/s diversion flow added to peak discharge values from 1984 to 2002. Prior to 1984 measured diversions were included in the annual peak flows.
7 150 ft3/s diversion flow added to peak discharge values from 1984 to 2002. Prior to 1984 measured diversions were included in the annual peak flows.
8 Site is partially affected by upstream lake and reservoir regulation.


Flooding on the Calapooya River, November 1996

Flooding on November 19, 1996, on the Calapooya River at the Rochester Bridge located on County Road 10-A near Sutherlin. (Photograph courtesy of Douglas County Department of Public Works, Roseburg, Oregon.)

Debris flow along Hubbard Creek

This November 1996 debris flow along Hubbard Creek killed four people. Debris flows occur when soils saturated by extended heavy rainfall give way, carrying rocks and other debris, sometimes long distances. (Photograph by Amiran White, Roseburg, Oregon, News Review; used by permission.)

December Floods

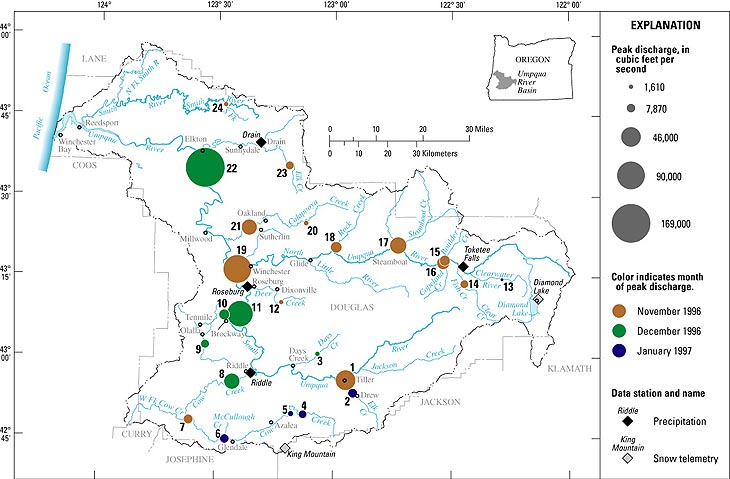
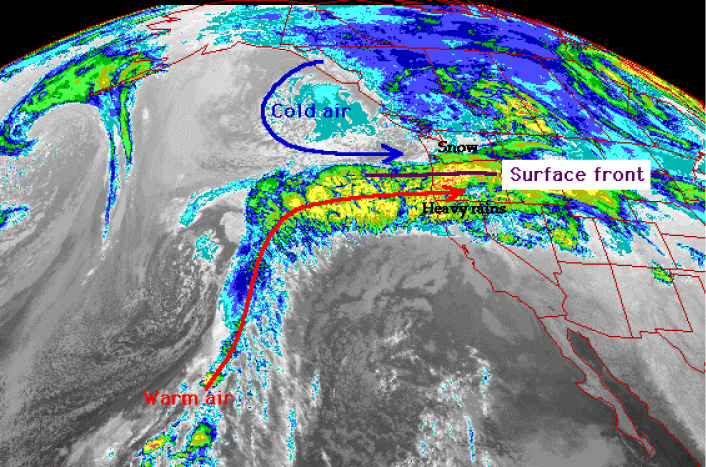
Most of the December flooding occurred early in the month in response to a series of storms. Precipitation for December 8 at Roseburg, Riddle, and King Mountain was 3.53, 2.75, and 4.2 inches, respectively (table 1). Unlike the November 16-19 storm, the December storms resulted in some snow accumulation at higher elevations. Precipitation for the period of December 3-9 contributed to both snowpack and runoff. The December flooding was more severe in the South Umpqua River Basin than the November flooding, which was more severe in the North Umpqua River Basin. The recurrence interval for the December peak discharges within the entire basin ranged from more than 2 to less than 25 years (table 2). Most of the peak discharges occurred on December 8.

Aerial view of flooding on the lower Umpqua River in December 1996

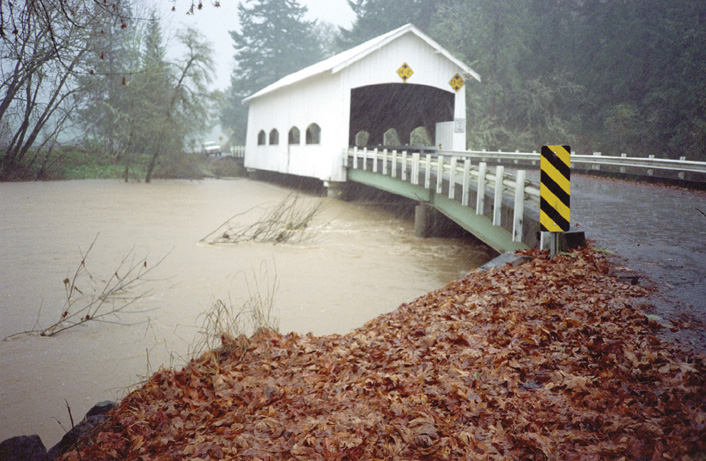
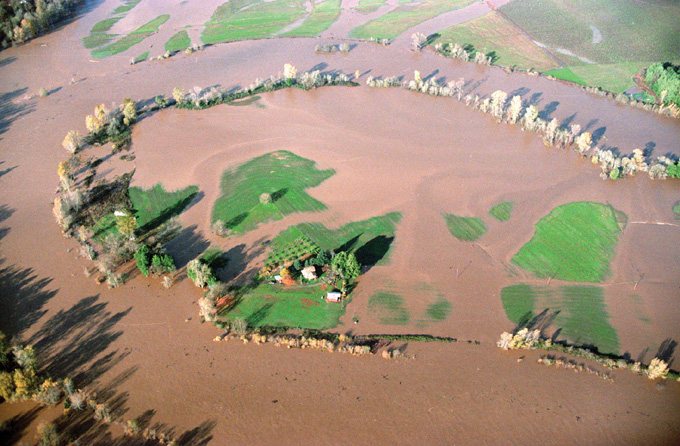
Aerial view of flooding on the lower Umpqua River in December 1996. (Photograph by Jerry Redfern, Roseburg, Oregon, News Review; used by permission.

January Floods

Another moist subtropical weather system brought steady rain starting around December 28 and continuing until January 2. Snowpack and air temperature data collected during this period at the King Mountain and Diamond Lake SNOTEL stations showed a net depletion of the preexisting snowpack. Most of the January peak discharges occurred on January 1 within the Umpqua River Basin. However, a separate storm later in the month caused January peak discharges to occur on January 31 in some tributary creeks in the lower section of the Umpqua River. The recurrence interval for the January peak discharges ranged from less than 2 to more than 100 years (table 2).

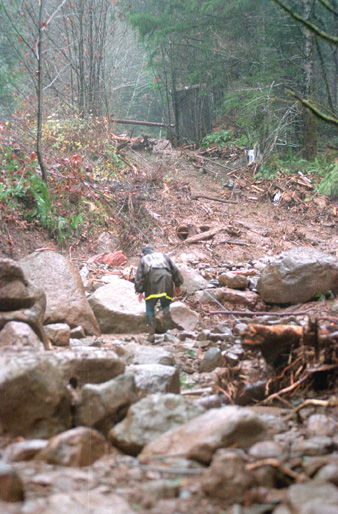
The most severe flooding occurred in the upland reaches of the South Umpqua River Basin. Although the magnitudes of the November floods at some sites were greater than those of the January floods, the January floods caused more damage. After 3 months of above average precipitation throughout the Umpqua River Basin, soils had become saturated by January, and conditions were more conducive to landslides and road failures than they were earlier in the season. Damage to roads and bridges within the Umpqua National Forest caused by the January floods were roughly equivalent to damage caused by the November and December floods combined (Mikeal Jones, USDA Forest Service, written commun., 2004).

References Cited

U.S. Interagency Advisory Committee on Water Data, 1982, Guidelines for determining flood flow frequency, Bulletin 17B of the Hydrology Subcommittee: Reston, Virginia, U.S. Geological Survey, Office of Water Data Coordination, 183 p.

Acknowledgements

This publication was produced in cooperation with the USDA Forest Service, Umpqua National Forest; Bureau of Land Management, Roseburg District; and the Oregon Water Resources Department, Douglas County Watermaster. Special thanks for assistance from Mikeal Jones, Umpqua National Forest, and Elaine Youngquist, Public Works Department, Douglas County, Oregon.

For More Information:

The U.S. Geological Survey has served the public and Federal, State, Tribal, and local governments since 1879 by collecting, analyzing, and publishing detailed information about the Nation's mineral, land, and water resources. For more information on water resources in Oregon:

Public Information Specialist
U.S. Geological Survey
10615 SE Cherry Blossom Dr.
Portland, Oregon, 97216
tel: (503) 251-3200
fax: (503) 251-3470
e-mail: info-or@usgs.gov

Selected data and interpretive reports are available from the USGS Oregon District Web site: http://or.water.usgs.gov/.

Photo of debris in backyards of houses next to flooding river.

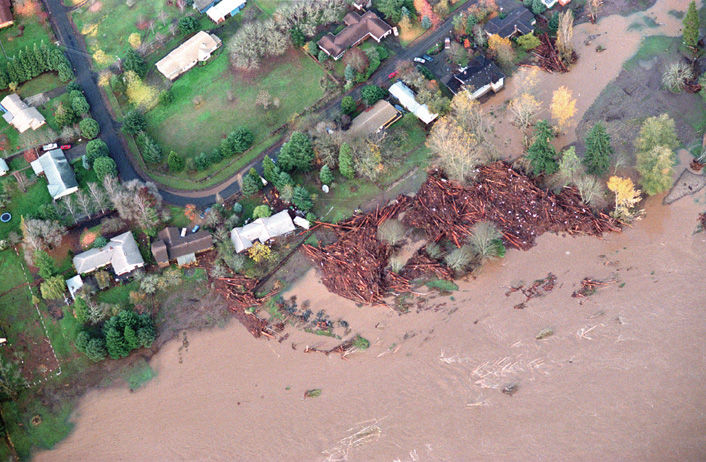
Floodwaters carried logs and other debris into backyards along the North Umpqua River near Winchester during the November 1996 floods. (Photograph by Jerry Redfern, Roseburg, Oregon, News Review; used by permission.)

Photo of trucks that wrecked when Interstate 5 washed out due to flooding.

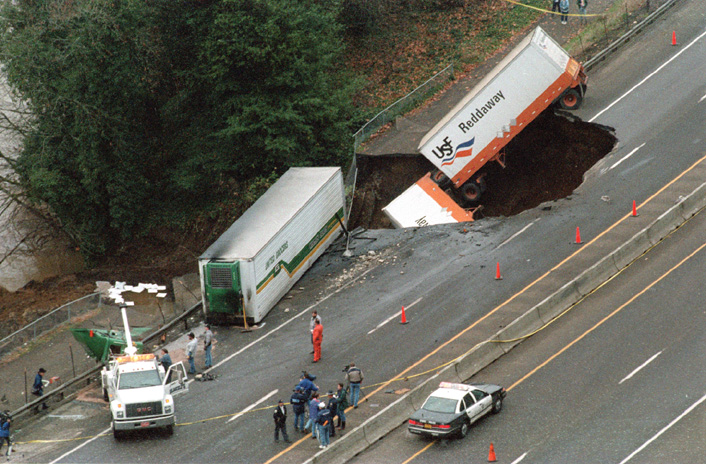
A mudslide on November 21, 1996, resulted in the collapse of a section of Interstate 5 along the South Umpqua River near Roseburg, Oregon. Damage to roads and bridges was widespread during the storms of November- January 1996-97. (Photograph by Christian Murdock, Roseburg, Oregon, News Review; used by permission.)

Photo of man knee-deep in flood water leaving his home.

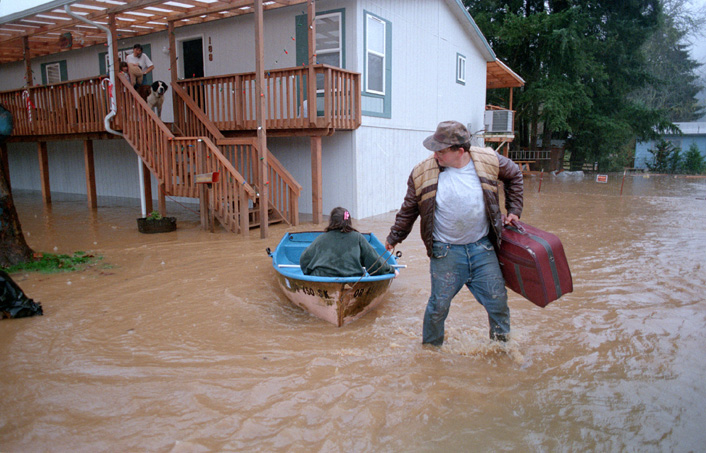
Flooding forced many residents to evacuate their homes. (Photograph by Christian Murdock, Roseburg, Oregon, News Review; used by permission.)


FirstGov button  Take Pride in America button