 |
|
|
||||
| PUBLICATIONS—Fact Sheet 2005-3014 Version 1.1 |
Mercury contamination from historical gold mines represents a potential risk to human health and the environment. This fact sheet provides background information on the use of mercury in historical gold mining and processing operations in California, with emphasis on historical hydraulic mining areas. It also describes results of recent USGS projects that address the potential risks associated with mercury contamination.
Miners used mercury (quicksilver) to recover gold throughout the western United States. Gold deposits were either hardrock (lode, gold-quartz veins) or placer (alluvial, unconsolidated gravels). Underground methods (adits and shafts) were used to mine hardrock gold deposits. Hydraulic, drift, or dredging methods were used to mine the placer gold deposits. Mercury was used to enhance gold recovery in all the various types of mining operations; historical records indicate that more mercury was used and lost at hydraulic mines than at other types of mines. On the basis of USGS studies and other recent work, a better understanding is emerging of mercury distribution, ongoing transport, transformation processes, and the extent of biological uptake in areas affected by historical gold mining. This information has been used extensively by federal, state, and local agencies responsible for resource management and public health in California.
Vast gravel deposits from ancestral rivers within the Sierra Nevada contained large quantities of placer gold, derived from the weathering of gold-quartz veins. Gold mining evolved from hydraulic mining of unconsolidated placer deposits in the early days of the Gold Rush, to underground mining of hardrock deposits, and finally to large-scale dredging of low-grade gravel deposits, which in many areas included the tailings from upstream hydraulic mines.
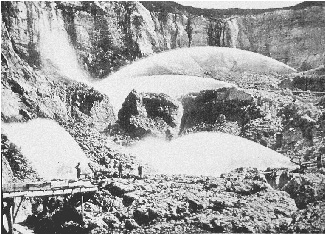
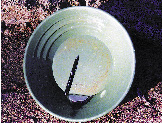
By the mid-1850s, in areas with sufficient surface water, hydraulic mining was the most cost-effective method to recover large amounts of gold. Monitors (or water cannons, fig. 1) were used to break down placer ores, and the resulting slurry was directed through sluices (fig. 2). As mining progressed into deeper gravels, tunnels were constructed to facilitate drainage and to remove debris from the bottom of hydraulic mine pits. The tunnels also provided a protected environment for sluices and a way to discharge processed sediments (placer tailings) to adjacent waterways. Gold particles were recovered by mechanical settling in troughs (riffles) within the sluices and by chemical reaction with liquid mercury to form gold-mercury amalgam. Loss of mercury during gold processing was estimated to be 10 to 30 percent per season (Bowie, 1905), resulting in highly contaminated sediments at mine sites, especially in sluices and drainage tunnels (fig. 3). From the 1850s to the 1880s, more than 1.5 billion cubic yards of gold-bearing placer gravels were processed by hydraulic mining in California's northern Sierra Nevada region. The resulting debris caused property damage and flooding downstream. In 1884, the Sawyer Decision prohibited discharge of hydraulic mining debris to rivers and streams in the Sierra Nevada region, but not in the Klamath-Trinity Mountains (fig. 4), where such mining continued until the 1950s.
 |
|---|
| Figure 3. Gold pan with more than 30 grams of mercury from 1 kilogram of mercury-contaminated sediments collected in a drainage tunnel. |
Underground mining of placer deposits (drift mining) and of hardrock gold-quartz vein deposits produced most of California's gold from the mid-1880s to the 1930s. Another important source of gold from the late 1890s to the 1960s was gold-bearing sediment, which was mined using dredging methods. More than 3.6 billion cubic yards of gravel was mined in the foothills of the Sierra Nevada, where the dredging continued until 2003.
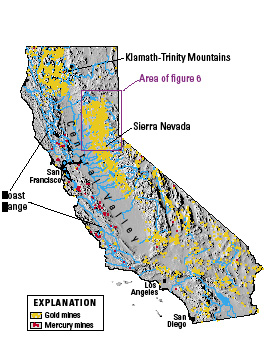
Most of the mercury used in gold recovery in California was obtained from mercury deposits in the Coast Range on the west side of California's Central Valley (fig. 4). Total mercury production in California between 1850 and 1981 was more than 220,000,000 lb (pounds) (Churchill, 2000); production peaked in the late 1870s (Bradley, 1918). Although most of this mercury was exported around the Pacific Rim or transported to Nevada and other western states, about 12 percent (26,000,000 lb) was used for gold recovery in California, mostly in the Sierra Nevada and Klamath-Trinity Mountains.
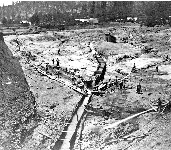
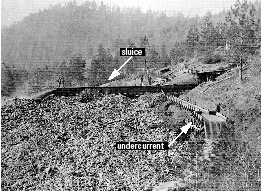
To enhance gold recovery from hydraulic mining, hundreds of pounds of liquid mercury (several 76-lb flasks) were added to riffles and troughs in a typical sluice. The high density of mercury allowed gold and gold-mercury amalgam to sink while sand and gravel passed over the mercury and through the sluice. Large volumes of turbulent water flowing through the sluice caused many of the finer gold and mercury particles to wash through and out of the sluice before they could settle in the mercury-laden riffles. A modification known as an undercurrent (fig. 5) reduced this loss. The finer grained particles were diverted to the undercurrent, where gold was amalgamated on mercury-lined copper plates. Most of the mercury remained on the copper plates; however, some was lost to the flowing slurry and was transported to downstream environments.
 |
|---|
| Figure 5. Undercurrent in use, circa 1860, Siskyou County, California. |
Gravel and cobbles that entered the sluice at high velocity caused the mercury to flour, or break into tiny particles. Flouring was aggravated by agitation, exposure of mercury to air, and other chemical reactions. Eventually, the entire bottom of the sluice became coated with mercury. Some mercury was lost from the sluice, either by leaking into underlying soils and bedrock or being transported downstream with the placer tailings. Minute particles of quicksilver could be found floating on surface water as far as 20 miles downstream of mining operations (Bowie, 1905). Some remobilized placer sediments, especially the coarser material, remain close to their source in ravines that drained the hydraulic mines.
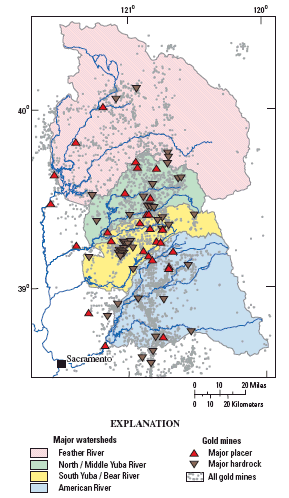
Mercury use in sluices varied from 0.1 to 0.36 lb per square foot. A typical sluice had an area of several thousand square feet; several hundred lb of mercury were added during initial start-up, after which several additional 76-lb flasks were added weekly to monthly throughout the operating season (generally 6 to 8 months, depending on water availability). During the late 1800s, under the best operating conditions, sluices lost about 10 percent of the added mercury per year (Averill, 1946), but under average conditions, the annual loss was about 25 percent (Bowie, 1905). Assuming a 10- to 30-percent annual loss rate, a typical sluice likely lost several hundred pounds of mercury during the operating season (Hunerlach and others, 1999). From the 1860s through the early 1900s, hundreds of hydraulic placer-gold mines were operated in California, especially in the northern Sierra Nevada (fig. 6). The total amount of mercury lost to the environment from placer mining operations throughout California has been estimated at 10,000,000 lb, of which probably 80 to 90 percent was in the Sierra Nevada (Churchill, 2000).
Historical records indicate that about 3,000,000 lb of mercury were lost at hardrock mines, where gold ore was crushed using stamp mills (Churchill, 2000). Mercury was also used extensively at drift mines and in dredging operations. Mercury was used widely until the early 1960s in the dredging of auriferous sediment from alluvial flood-plain deposits. Today, mercury is recovered as a by-product from small-scale gold-dredging operations; also, mercury and gold are recovered as byproducts from some gravel-mining operations, especially in areas affected by historical gold mining. Understanding the present distribution and fate of the mercury used in historical gold mining operations is the subject of ongoing multi-disciplinary studies.
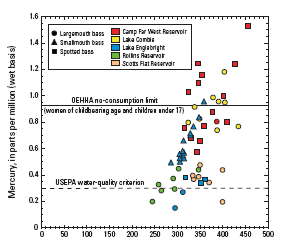
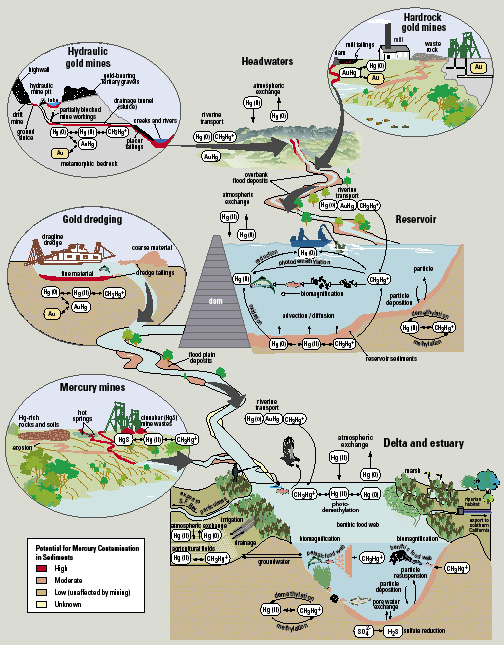
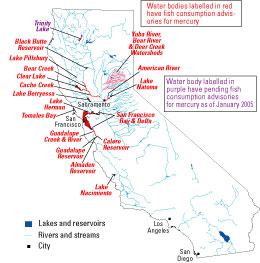
In cooperation with federal land-management agencies (the Bureau of Land Management and the U.S. Forest Service) and various state and local agencies, USGS scientists have investigated mercury contamination at abandoned mine sites and downstream environments in the Bear River and Yuba River watersheds (fig. 6) since 1999. Fish from reservoirs and streams in the Bear-Yuba watersheds (fig. 7) have bioaccumulated sufficient mercury (May and others, 2000) to pose a risk to human health (Klasing and Brodberg, 2003). A conceptual diagram (fig. 8) summarizes known mercury sources, transport mechanisms, and bioaccumulation pathways. Based primarily on data from other USGS studies (for example, Saiki and others, 2004), additional fish consumption advisories regarding mercury in other areas of northern California affected by historical gold mining (fig. 9) have been issued.
The USGS and cooperating agencies have identified several "hot spots" of mercury contamination and bioaccumulation by reconnaissance sampling of water, sediment, and biota at numerous hydraulic mine sites in the Bear-Yuba watersheds (Alpers and others, 2005). Subsequently, some mercury-contaminated mine sites have been remediated by other federal agencies, and remediation plans are being developed for other sites. Mercury contamination has also been investigated in dredge fields at lower Clear Creek (Ashley and others, 2002), the Trinity River, and the lower Yuba River (Hunerlach and others, 2004). These investigations show that total mercury concentrations in dredge tailings tend to be most elevated in the finest grained sediments. The State of California has listed several water bodies in the Bear-Yuba watersheds as impaired with regard to beneficial uses, starting a regulatory process that may include eventual mercury-load reduction through Total Maximum Daily Loads (TMDLs). The USGS is providing data and information to stakeholders through ongoing studies of mercury and methylmercury loads in the Bear River, mercury fluxes from reservoir sediments (Kuwabara and others, 2003), mercury methylation and demethylation processes in sediment, and mercury bioaccumulation in the food web of Camp Far West Reservoir.
 |
|---|
| Figure 9. Locations of health advisories for mercury in sport fish consumed in California. Source: California Office of Environmental Health Hazard Assessment, accessed October 12, 2005 (http://www.oehha.ca.gov/fish.html). |
Mercury occurs in several different geochemical forms, including elemental mercury [Hg(0)], ionic (or oxidized) mercury [Hg(II)], and a suite of organic forms, the most important of which is methylmercury (CH 3 Hg + ). Methylmercury is the form most readily incorporated into biological tissues and most toxic to humans. The transformation from elemental mercury to methylmercury is a complex biogeochemical process that requires at least two steps, as shown in figure 8: (1) oxidation of Hg(0) to Hg(II), followed by (2) transformation from Hg(II) to CH 3 Hg + ; step 2 is referred to as methylation. Mercury methylation is controlled by sulfate-reducing bacteria and other microbes that tend to thrive in conditions of low dissolved oxygen, such as near the sediment-water interface or in algal mats. Numerous environmental factors influence the rates of mercury methylation and the reverse reaction known as demethylation. These factors include temperature, dissolved organic carbon, salinity, acidity (pH), oxidation-reduction conditions, and the form and concentration of sulfur in water and sediments.
The concentration of CH 3 Hg + generally increases by a factor of ten or less with each step up the food chain, a process known as biomagnification . Therefore, even though the concentrations of Hg(0), Hg(II), and CH 3 Hg + in water may be very low and deemed safe for human consumption in drinking water, CH 3 Hg + concentration levels in fish, especially predatory species such as bass and catfish, may reach levels that are considered potentially harmful to humans and fish-eating wildlife, such as bald eagles.
Methylmercury (CH3Hg+) is a potent neurotoxin that impairs the nervous system. Fetuses and young children are more sensitive to methylmercury exposure than adults. Methylmercury can cause many types of problems in children, including damage to the brain and nervous system, mental impairment, seizures, abnormal muscle tone, and problems in coordination. Therefore, the consumption guidelines in areas where CH3Hg+ is known to occur in fish at potentially harmful levels tend to be more restrictive for children as well as for pregnant women, nursing mothers, and other women of childbearing age.
In the United States, as of 2003, there were a total of 2,800 fish and wildlife consumption advisories for all substances, of which 2,140 (more than 76 percent) were for mercury. Forty-five states have issued advisories for mercury, and 19 states have statewide advisories for mercury in all freshwater lakes and (or) rivers.
As of October 2005, the state of California had issued fish consumption advisories for mercury in about 20 waterbodies, including the San Francisco Bay-Delta region and several areas in the Coast Range affected by mercury mining (fig. 9; compare with fig. 4). Water bodies with advisories based on USGS fish-tissue data include the Bear River and Yuba River watersheds of the Sierra Nevada (Klasing and Brodberg, 2003), the lower American River including Lake Natoma (Klasing and Brodberg, 2004), and the Trinity Lake area.
Alpers, C.N., Hunerlach, M.P., May, J.T., Hothem, R.L., Taylor, H.E., Antweiler, R.C., De Wild, J.F., and Lawler, D.A., 2005, Geochemical characterization of water, sediment, and biota affected by mercury contamination and acidic drainage from historical gold mining, Greenhorn Creek, Nevada County, California, 1999-2001: U.S. Geological Survey Scientific Investigations Report 2004-5251, 278 p. Available at https://pubs.usgs.gov/sir/2004-5251/
Ashley, R.P., Rytuba, J.J., Rogers, Ronald, Kotlyar, B.B., and Lawler, David, 2002, Preliminary report on mercury geochemistry of placer gold dredge tailings, sediments, bedrock, and waters in the Clear Creek restoration area, Shasta County, California: U.S. Geological Survey Open-File Report 02-401, 43 p. Available at http://geopubs.wr.usgs.gov/open-file/of02-401/
Averill, C.V., 1946, Placer mining for gold in California: California State Division of Mines and Geology Bulletin 135, 336 p.
Bowie, A.J., 1905, A practical treatise on hydraulic mining in California: New York, Van Nostrand, 313 p.
Bradley, E.M., 1918, Quicksilver resources of the state of California: California State Mining Bureau Bulletin 78, 389 p.
Churchill, R.K., 2000, Contributions of mercury to California's environment from mercury and gold mining activities; Insights from the historical record, in Extended abstracts for the U.S. EPA sponsored meeting, Assessing and Managing Mercury from Historic and Current Mining Activities, November 28-30, 2000, San Francisco, Calif., p. 33-36 and S35-S48.
Hunerlach, M.P., Alpers, C.N., Marvin-DiPasquale, M., Taylor, H.E., and De Wild, J.F., 2004, Geochemistry of mercury and other trace elements in fluvial tailings upstream of Daguerre Point Dam, Yuba River, California, August 2001: U.S. Geological Survey Scientific Investigations Report 2004-5165, 66 p. Available at https://pubs.water.usgs.gov/sir2004-5165/
Hunerlach, M.P., Rytuba, J.J., and Alpers, C.N., 1999, Mercury contamination from hydraulic placer-gold mining in the Dutch Flat mining district, California: U.S. Geological Survey Water-Resources Investigations Report 99-4018B, p. 179-189. Available at http://ca.water.usgs.gov/mercury/dutch/wrir994018b.pdf
Klasing, Susan, and Brodberg, Robert, 2003, Evaluation of potential health effects of eating fish from selected water bodies in the northern Sierra Nevada Foothills (Nevada, Placer, and Yuba Counties): Guidelines for sport fish consumption: California Office of Environmental Health Hazard Assessment, 48 p. Available athttp://www.oehha.ca.gov/fish/pdf/SierraLakesAdvisoryfinal.pdf
Klasing, Susan, and Brodberg, Robert, 2004, Fish consumption guidelines for Lake Natoma (including nearby creeks and ponds) and the lower American River (Sacramento County): California Office of Environmental Health Hazard Assessment, 41 p. Available at http://www.oehha.ca.gov/fish/pdf/NatomaFinalAdvisory9204.pdf
Kuwabara, J.S., Alpers, C.N., Marvin-DiPasquale, M., Topping, B.R., Carter, J.L., Stewart, A.R., Fend, S.V., Parchaso, F., Moon, G.E., and Krabbenhoft, D.P., 2003, Sediment-water interactions affecting dissolved-mercury distributions in Camp Far West Reservoir, California: U.S. Geological Survey Water-Resources Investigations Report 03-4140, 64 p. Available at https://pubs.water.usgs.gov/wri03-4140/
Long, K.R., DeYoung, J.H., Jr., and Ludington, S.D., 1998, Database of significant deposits of gold, silver, copper, lead, and zinc in the United States: U.S. Geological Survey Open-File Report 98-206A, 33 p. Available at http://geopubs.wr.usgs.gov/open-file/of98-206/of98-206a.pdf
May, J.T., Hothem, R.L., Alpers, C.N., and Law, M.A., 2000, Mercury bioaccumulation in fish in a region affected by historic gold mining: The South Yuba River, Deer Creek, and Bear River watersheds, California, 1999: U.S. Geological Survey Open-File Report 00-367, 30 p. https://pubs.water.usgs.gov/ofr00-367/
Saiki, M.K., Slotton, D.G., May, T.W., Ayers, S.M., and Alpers, C.N., 2004, Summary of total mercury concentrations in fillets of selected sport fishes collected during 2000-2003 from Lake Natoma, Sacramento County, California: U.S. Geological Survey Data Series 103, 21 p. Available at https://pubs.water.usgs.gov/ds103/
U.S. Environmental Protection Agency, 2001, Water quality criterion for the protection of human health: Methylmercury: EPA-823-R-01-001, 16 p. Available at http://www.epa.gov/waterscience/criteria/methylmercury/merctitl.pdf
| Cooperating Agencies and Stakeholder Groups |
 |
|
Charles N. Alpers (916) 278-3134
Jason T. May (916) 278-3079
U.S. Geological Survey |
Roger L. Hothem (707) 678-0682 ext. 626 U.S. Geological Survey Web links: |
Document Accessibility: Adobe Systems Incorporated has information about PDFs and the visually impaired. This information provides tools to help make PDF files accessible. These tools convert Adobe PDF documents into HTML or ASCII text, which then can be read by a number of common screen-reading programs that synthesize text as audible speech. In addition, an accessible version of Acrobat Reader 6.0, which contains support for screen readers, is available. These tools and the accessible reader may be obtained free from Adobe at Adobe Access.
| AccessibilityFOIAPrivacyPolicies and Notices | |
 |
|