
Fact Sheet 2005-3017
March 2005
This factsheet is available as a pdf.
| This Fact Sheet is one in a series that highlights information or recent research findings from the USGS National Streamflow Information Program (NSIP). The investigations and scientific results reported in this series require a nationally consistent streamgaging network with stable long-term monitoring sites and a rigorous program of data quality assurance, management, archiving, and synthesis. NSIP produces multi-purpose, unbiased surface water information that is readily accessible to all. |
Recent studies have reported increases in precipitation across the United States during the 20th century (Karl and Knight, 1998; Groisman and others, 2004). These increases have been observed over a range of precipitation intensities, and particularly in categories characterized as heavy and extreme. This has led some researchers to suggest that extreme hydrological events, particularly floods, may be increasing in frequency and/or magnitude as well. The basis for this suggestion is related to climate change research, which hypothesizes that increasing temperatures will accelerate the hydrologic cycle and increase the occurrence of floods and droughts. Using long-term streamflow records from the U.S. Geological Survey (USGS) National Streamflow Information Program (NSIP), it is possible to evaluate whether floods and droughts have, indeed, increased in recent decades in response to climatic conditions.
The key to determining changes in floods and droughts is a stable, long-term network of streamgages, including streamgages on watercourses that are relatively free of confounding human influences such as dams, impoundments, and diversions. The USGS maintains a database representing approximately 22,700 streamgages. Only about 7,000 of these are still active and more than one-half of these gages have less than 30 years of continuous record to the present time. Streamgage records of at least 30 years, and preferably greater than 50 years, are essential for assessing trends because climate naturally varies from year-to-year and decade-to-decade. Such short-term natural variations can obscure or falsely indicate a long-term trend.
In addition, the flow of water in most rivers in the United States reflects some level of human activity. Dams and diversions for irrigation may be the most cited activities, but ground-water pumping and land-use change are also important factors. Human activities can substantially influence the variability of streamflow in response to weather and climatic conditions. Indeed, dams are constructed in part to reduce flooding and to increase flows during drought. Thus, to evaluate streamflow variability and change in a climatic context, the USGS identified over 1,600 streamgages where the discharge was primarily influenced by climatic variations (fig. 1). These streamgages form the USGS Hydro-Climatic Data Network (HCDN), monitoring watersheds where the data are appropriate to the study of such Federal interest problems and issues as flood frequency, drought severity, and long-term climatic change (Slack and Landwehr, 1992).
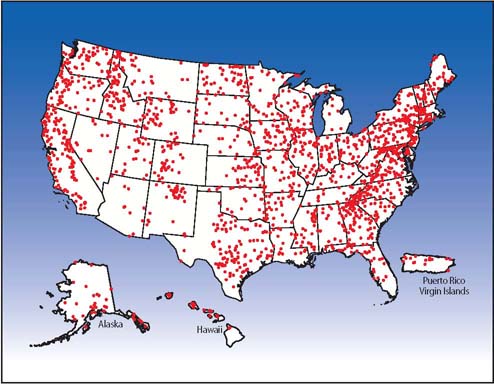 |
| Figure 1. Location of 1,659 Hydro-Climatic Data Network (HCDN) streamgaging stations. |
Although more than 1,600 stream-gage records have been identified as being climate-sensitive, most of these have record lengths of less than 30 years and, in many instances, less than 20 years. The number of HCDN streamgages in the United States with 60 years of record (1940-1999) is 435, but this number drops to 211 with 70 years of record, 69 with 80 years of record, and only 15 streamgages with 90 years of record. As a result, it is not possible to get an accurate estimate of trends in United States streamflow for the entire 20th century, although it is possible to get an accurate estimate for the later two-thirds of the century.
The USGS has studied trends in streamflow using a variety of approaches (Lins and Michaels, 1994; Lins and Slack, 1999; McCabe and Wolock, 2002). Although each approach has yielded unique insights, all have arrived at one important conclusion: streamflow has been increasing in the United States since at least 1940. In addition, these increases have not been uniform across the range of annual streamflows, from the minimum to the maximum, nor have they been uniform geographically or seasonally.
For example, most of the increases were found to occur in low to moderate streamflows. In one study, trends were determined across the entire range of streamflows, from the annual minimum (the 0th percentile) to the annual maximum (the 100th percentile), using data from the 435 HCDN stations (fig. 2). Between 1940 and 1999, 40 percent of the stations tested experienced a streamflow increase in the annual minimum flow, 43 percent in the annual median flow, but only 10 percent in the annual maximum flow. In contrast, only 8 percent of the stations had decreases in the annual minimum flow, less than 1 percent in the annual median, and 3 percent in the annual maximum. In other words, low to moderate streamflow volumes have been increasing at many locations, but high streamflow volumes have increased at relatively few locations.
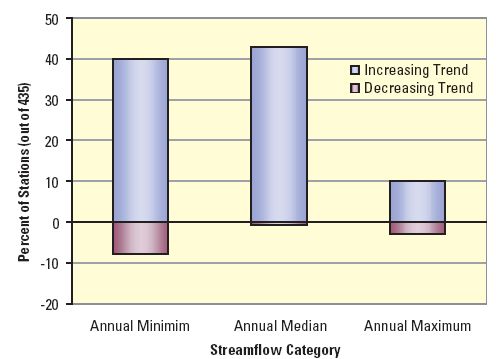 |
| Figure 2. Percent of streamgages, out of 435 nationwide, where significant trends were observed in the annual minimum, median, and maximum streamflow during the 60-year period, 1940-1999. |
Geographically, the pattern of trends is quite varied (fig. 3). Regions that experienced the most widespread increases were the Upper Mississippi, Ohio Valley, Texas-Gulf, and the Mid-Atlantic. Fewer trends were observed in the South Atlantic-Gulf, Missouri, and regions of the far West. The Pacific Northwest and the South Atlantic-Gulf actually had a number of streamflow decreases, particularly in the lowest percentiles.
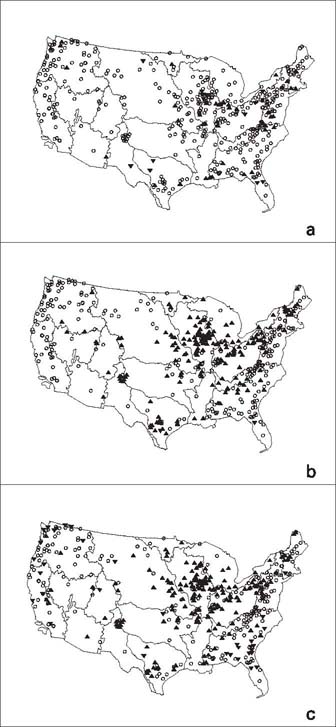 |
| Figure 3. Trends (p<0.05) in (a) annual maximum daily, (b) annual median daily, and (c) annual minimum daily discharge in relation to U.S. water resource regions for the period 1940-1999. Upward-pointing triangles indicate increasing discharge, downward-pointing decreasing, and open circles (o) denote no trend. |
The seasonal distribution of observed trends also is not uniform. The pattern of trends is dominated by increases in the late summer and autumn months of September through December. This is particularly true in the case of the Upper Mississippi and Ohio Valley regions. It is consistent with observed increases in streamflow at the low to moderate percentiles, which generally occur during the late summer and autumn period. This result also is consistent with reported precipitation increases in the United States, which have been greatest during the autumn season.
Another aspect of the observed trends is that they appear to have occurred around 1970 as an abrupt rather than gradual change (fig. 4). An assessment of trends at 400 HCDN stations between 1941 and 1999 found that annual departures from long-term average conditions for the annual maximum, median, and minimum flows were primarily negative prior to 1970 and primarily positive thereafter. The pattern was less striking in the annual maximum, but apparent nonetheless. Both sudden and gradual changes can be found in historical climatic and hydrologic records, and each type of change has distinct implications. A slow, gradual trend implies a pattern that is likely to continue into the future. A rapid step change typically indicates a regime shift from one set of conditions to another, with the new conditions likely to persist until the next sudden shift occurs. What this may mean for future variations and changes in U.S. streamflow will only be revealed with time but, based on nearly a century of observations, we should expect our rivers and streams to continue to be characterized by both short- and long-term variations.
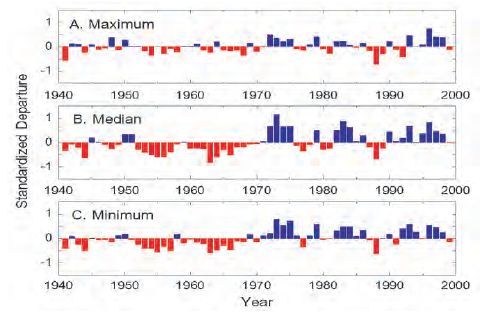 |
| Figure 4. Annual departures from the maximum (A), median (B), and minimum (C) daily streamflow for 400 streamgaging stations in the conterminous United States 1941-1999. |
For additional information, contact:
Harry Lins
U.S. Geological Survey
415 National Center
Reston, VA 20192
(703)648-5712 or hlins@usgs.gov
Groisman, P.Ya., Knight, R.W., Karl, T.R., Easterling, D.R., Sun, B. and Lawrimore, J.H., 2004. Contemporary changes of the hydrological cycle over the cotiguous United States: trends derived from in situ observations: J. Hydrometeor., 5, 64-85.
Karl, T.R. and Knight, R.W., 1998. Secular trends of percipitation amount, frequency, and intensity in the United States: Bull. Amer. Meteor. Soc., 79, 231-241.
Lins, H.F. and Michaels, P.J., 1994. Increasing U.S. streamflow linked to greenhouse forcing: Eos, 75, 281,284-285.
Lins, H.F. and Slack, J.R., 1999. Streamflow trends in the United States: Geophys. Res. Lett., 26, 227-230.
McCabe, G.J. and Wolock, D.M., 2002. A step increase in streamflow in the conterminous United States: Geophys. Res. Lett., 29, 2185-2188.
Slack, J.R. and Landwehr, J.M., 1992. Hydro-climatic data network: a U.S. Geological Survey streamflow data set for the United States for the study of climate variations, 1874-1988: U.S. Geol. Surv. Open-File Rept. 92-129, 193 pp.
This factsheet is available online in Portable Document Format (PDF). If you do not have the Adobe Acrobat PDF Reader, it is available for free download from Adobe Systems Incorporated.
Download the report (PDF,1.1 MB)
Document Accessibility: Adobe Systems Incorporated has information about PDFs and the visually impaired. This information provides tools to help make PDF files accessible. These tools convert Adobe PDF documents into HTML or ASCII text, which then can be read by a number of common screen-reading programs that synthesize text as audible speech. In addition, an accessible version of Acrobat Reader 5.0 for Windows (English only), which contains support for screen readers, is available. These tools and the accessible reader may be obtained free from Adobe at Adobe Access.
| AccessibilityFOIAPrivacyPolicies and Notices | |
 |
|