USGS Fact Sheet 2005-3036
Activity from September 2004 through March 2005 -- Major, J.J., Scott, W.E., Driedger, C., and Dzurisin, D., 2005, Mount St. Helens Erupts Again; Activity from September 2004 through March 2005: U.S. Geological Survey Fact Sheet 2005-3036, 4 p. |
|||||||||||||||||||||||||||||||||||||||||||||||||||
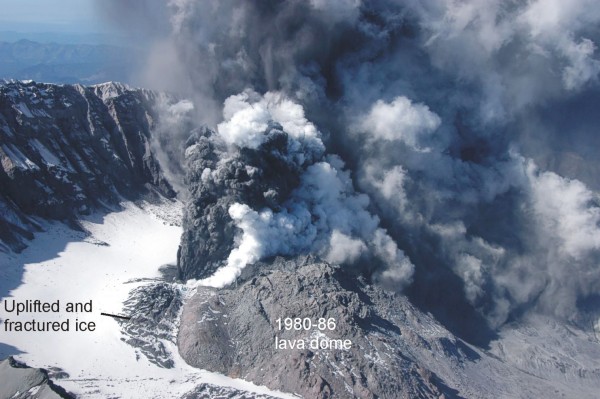
The Volcano Reawakens September 23-October 1, 2004 After 18 years of relative quiescence, Mount St. Helens volcano recaptured the world's attention when it showed signs of reawakening in September 2004. On September 23 a swarm of small (less than magnitude (M) 0), shallow (less than 1.5 miles below the surface) earthquakes began in and beneath the 1980-1986 lava dome. Initially this swarm resembled previous swarms that had not led to eruption. By September 24 many hundreds of earthquakes had occurred. Earthquake rates peaked that day at about 2 to 3 per minute then gradually declined, and it appeared that the swarm was ending. But on September 25 shallow earthquakes increased again in both size and rate. This reinvigorated level of seismicity prompted scientists to issue a notice of volcanic unrest for the first time since 1986. The release of energy by earthquakes increased dramatically during the next several days, and by October 1 earthquakes occurred nearly continuously. Peak sizes reached M3.5, and earthquakes larger than M2.5 occurred about once per minute. Concurrently, parts of the glacier south of the lava dome rose and cracked noticeably, creating a broad welt. The accelerated size and frequency of earthquakes and noticeable deformation of the glacier indicated that molten rock (magma) was rising toward the surface, and this prompted scientists to issue several types of hazard notifications in collaboration with the Gifford Pinchot National Forest and Washington State Emergency Management Division. Steam and Ash Explosions October 1-October 5, 2004 On October 1, an explosion lofted steam and ash several thousand feet above a vent blasted through the fractured glacier, and hurled rock fragments at least ½ mile across the western half of the glacier and 1980-1986 lava dome. Four more steam and ash explosions occurred through October 5. Of those five explosions, three produced noticeable fine-ash fallout downwind. Only the ashfall of October 5 affected populated areas: a light dusting of ash extended downwind (NNE) as much as 60 miles to the northeast part of Mount Rainier National Park. The size and frequency of earthquakes dropped following the first four explosions, but in each case built back within hours to pre-explosion levels. The level of earthquake activity dropped a final time after the largest explosion on October 5. From October 5 through March 2005, earthquake rates and sizes waxed and waned but never regained the peak levels of September 29 through October 5.
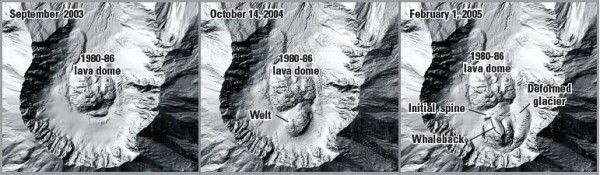
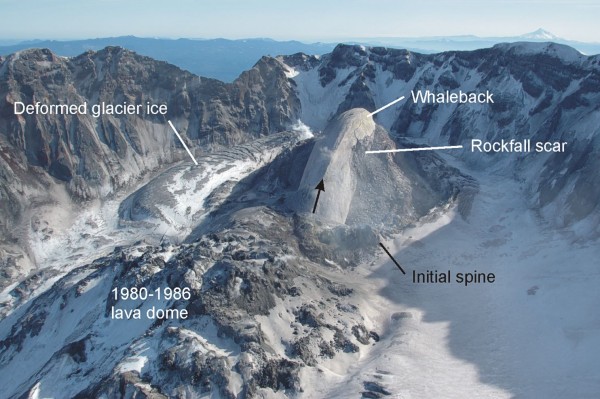
Lava Dome Growth October 6, 2004-March 31, 2005, and continuing Following the brief series of steam-and-ash explosions, the volcano settled into a quieter phase during which the welt continued to grow and a new lava dome appeared. Growth of the welt along with detection of volcanic gases (CO2, SO2, H2S) in early October provided clear evidence that magma had risen to or close to the level of the 1980 crater floor. On October 11, a spine of solid, but still hot, lava punctured the surface of the welt. As this initial spine grew upward, several smaller spines appeared nearby. In late October, a larger whalebackshaped extrusion of solid lava emerged immediately southeast of the initial spine. The early spines plus the whaleback extrusion are referred to as the new lava dome.
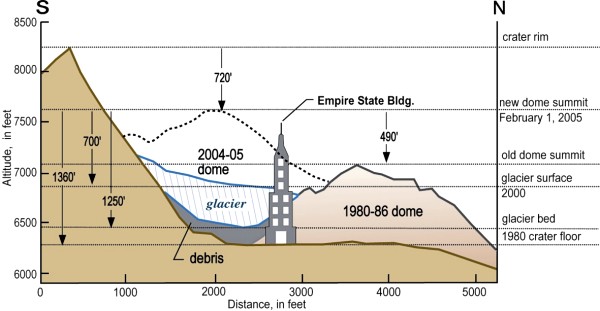
By early February 2005, the welt and new lava dome grew to a combined volume of about 50 million cubic yards, almost one-half the volume of the 1980-1986 lava dome. By then, the top of the new lava dome reached nearly 1,400 feet (taller than the Empire State Building) above the level of the 1980 crater floor, and the welt and new lava dome together covered an area equivalent to about 60 city blocks. Unlike lava domes at many other volcanoes, which form when lava accumulates and slowly flows over and around a volcanic vent, the new dome at Mount St. Helens has extruded as a solid mass, much like a piston being pushed from the ground. In contrast, during the 1980s dome growth at the volcano occurred when magma extruded onto the surface and formed short (650-1,300 feet), thick (65-130 feet) lava flows. The new lava dome extruded from the ground rapidly. Global Positioning System (GPS) stations slung into place on top of the dome by helicopter showed that in November 2004 a point on the whaleback moved southward as much as 35 feet per day. In January 2005 the rate of movement had slowed slightly to about 30 feet per day, and by mid- February 2005, motion had slowed to about 20 feet per day.
Effects of the Eruption on the New Glacier Deformation associated with intrusion of magma and extrusion of the new lava dome cleaved the crater glacier into two arms. The eastern arm of the glacier, pinched between the new lava dome and the east crater wall, bulged, fractured, and flowed northward rapidly (about 4 feet per day) in response. At many other volcanoes where lava has intruded into glacier ice, large floods have occurred. Despite losing at least 5% to 10% of the glacier ice volume (as of February 2005) to vaporization and melt, water flow from the crater of Mount St. Helens has changed little during the 2004-2005 eruption. In addition to losing steam to the atmosphere, the highly porous and permeable crater floor has presumably absorbed melt water like a giant sponge and allowed it to pass into the groundwater system within the volcano rather than pond at the base of, or within, the glacier and burst forth in a large flood.
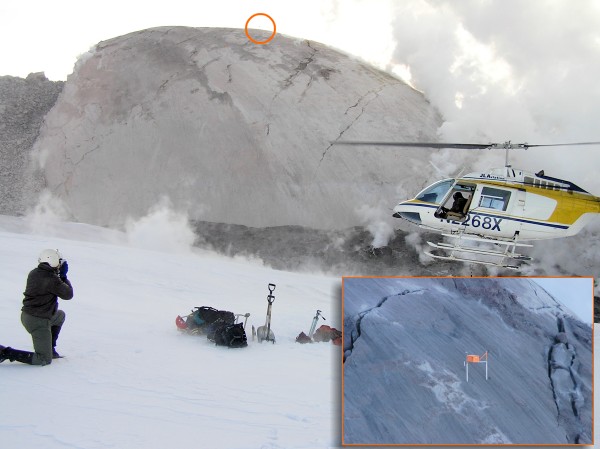
New Technologies for Monitoring Eruptions The remarkably rapid, but nearly steady, rate of dome growth and changes in the glacier surface, coupled with potential hazards from unheralded explosions, prompted development of new technologies to monitor the state of the volcano. Advances in digital technology allowed development of selfcontained instrument packages that could be slung to the volcano by helicopter and placed in a variety of settings. These packages have included seismometers to measure earthquakes, GPS units to track surface movement, and gas sensors. Such technological innovations have allowed scientists to gather critical data in the crater without compromising their own safety. In addition to the data gathered by these remotely deployed packages, conventional and digital photography, including vertical, oblique, fixed-station, and thermal imaging, have been used to document and quantify dome growth and surface changes. The various data are used not only to monitor the volcano but also to help refine ideas and models that explain how the volcano works.
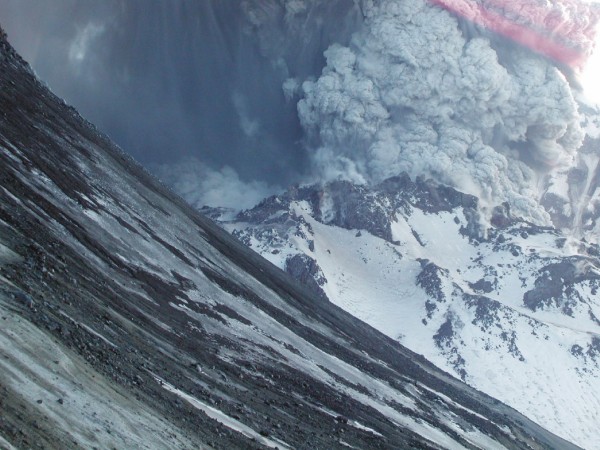
Potential Hazards Associated With Eruptive Activity Throughout its history Mount St. Helens has produced a wide variety of eruptive products, including lava flows, lava domes, and deposits of airfall pumice and ash, pyroclastic flows (swift avalanches of hot ash, pumice, and gas), landslides, and lahars (volcanic mudflows). The volcano is notorious for its gigantic landslide and subsequent powerful explosion on May 18, 1980, which claimed 57 lives, but smaller events are also potentially hazardous. The 2004-2005 dome-growth eruption
has been benign so far compared to
the May 18, 1980, eruption. Between
October 2004 and March 2005, however,
it produced two more notable explosions
(January 16 and March 8, 2005) that
lofted ash plumes (one to nearly 7 miles
above sea level, which drifted hundreds
of miles downwind) and hurled rock
fragments (to about 1 foot diameter) up
to a mile across the crater. Continued
growth and occasional collapse of the
new lava dome may produce additional
small explosions and also avalanches
of hot debris that sweep out from the
dome. Both explosions and hot rock
avalanches can create ash clouds that
drift downwind, which can endanger
aircraft and affect people on the ground.
rock avalanches or small explosions that
spew hot gases and ash can also swiftly
melt snow and ice and form floods or
lahars that surge out of the crater. Such
floods and lahars can endanger people
along the upper North Fork Toutle River.
Status of the Eruption and Outlook As of March 2005, dome growth that began in late 2004 continues. Although the rate of lava extrusion has waned slightly between November 2004 and March 2005, the new dome continues to build at a remarkable rate. Previous periods of dome-growth at the volcano have persisted (intermittently) for years to decades, punctuated by small-tomoderate explosive activity. Someday, episodic dome growth may eventually rebuild Mount St. Helens to a volcano resembling the near-perfect pre-1980 cone.
|
|||||||||||||||||||||||||||||||||||||||||||||||||||

![]() U.S. Department of the Interior |
U.S. Geological Survey
U.S. Department of the Interior |
U.S. Geological Survey
URL: http://pubsdata.usgs.gov/pubs/fs/2005/3036/fs2005-3036.html
Page Contact Information: GS Pubs Web Contact
Page Last Modified: Tuesday, 29-Nov-2016 18:17:01 EST