U.S. GEOLOGICAL SURVEY
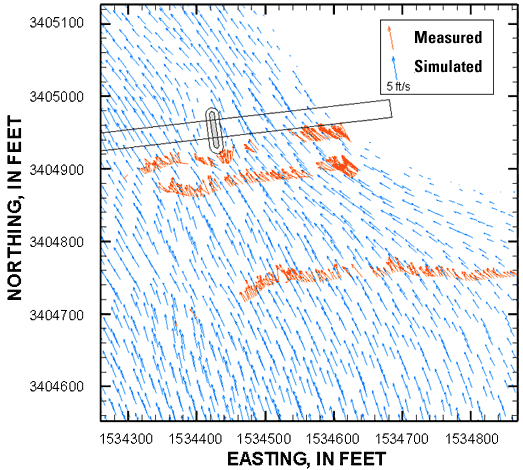
Figure 2. Comparison of simulated and measured velocities for the 780 m3/s calibration flow. The velocity was measured along traverses by using an ADCP; three seperate traverses across the river are shown. Measured velocities represent the velocity at a point in space and time compared to simulated velocities, which represent an average. Therefore, the measured velocities are expected to have more variability than the simulated velocities.

![]() U.S.
Department of the Interior | U.S. Geological
Survey
U.S.
Department of the Interior | U.S. Geological
Survey
Persistent URL: https://pubs.water.usgs.gov/fs20053078
Page Contact Information: Publications Team
Page Last Modified: Tuesday, 29-Nov-2016 18:17:48 EST
