Publications—Fact Sheets
U.S. Geological Survey Fact Sheet 2005-3081
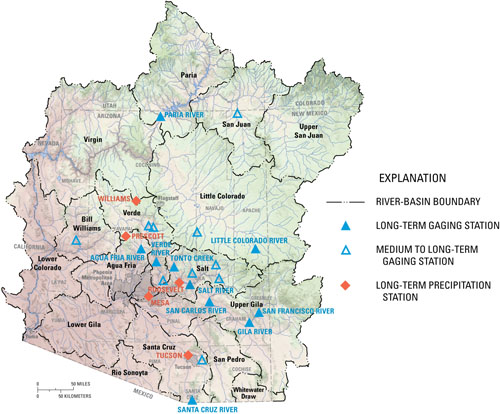 Figure 1. Locations of 10 long-term streamflow-gaging stations, 10 medium- to long-term gaging station, and 5 long-term precipitation stations.
 Arizona’s climate is prone to extreme changes that range from persistent droughts to frequent local and regional flooding. These changes are evident in hydrologic data collected. Streamflow records indicate that a drought in Arizona during 1999–2004 was the worst drought since the early 1940s and possibly earlier. Droughts result from a decrease in the number of already infrequent storms that bring moisture to Arizona. The drought conditions in the Southwestern United States over the last several years, and especially in Arizona, have resulted in several large summer fires, a decrease in potable water for some smaller communities, and depleted water available for surface water as well as ground-water recharge. An unusually wet December 2004 and January 2005 in Arizona has interrupted the multiyear drought. Dry conditions, however, still prevail in parts of Arizona. It is difficult to conclude, therefore, whether the drought is over or if it will persist.
Although the spatial and temporal extent of droughts is somewhat difficult to determine, three severe droughts during the 20th century were recognized in a 1989 U.S. Geological Survey National Water Summary (Paulson and others, 1991). The periods of significant statewide droughts, as indicated by records from several streamflow-gaging stations, were recognized as 1932–36, 1942–64, and 1974–77 (figs. 1 and 2; table 1).
This document utilizes long-term data from streamflow-gaging stations to compare the severity of the current drought to those indicated by Paulson and others (1991; fig. 2).
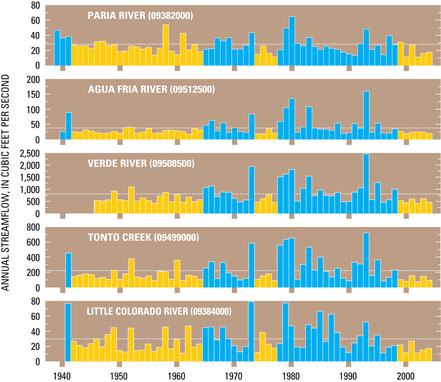 STREAMFLOW-GAGING STATIONS IN NORTHERN AND CENTRAL ARIZONA, 1939–2004—Drought periods shown in gold; horizontal line indicates long-term average. Record for the Paria River begins in 1923; data for 1923–38 not shown.
 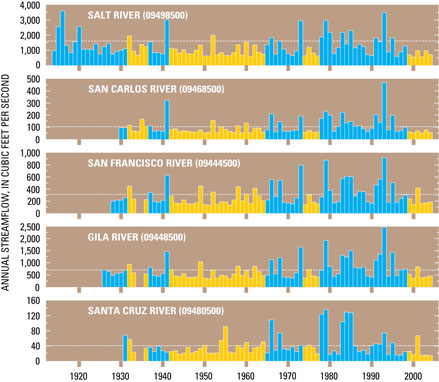 STREAMFLOW-GAGING STATIONS IN CENTRAL AND SOUTHERN ARIZONA, 1914–2004—Drought periods shown in gold; horizontal line indicates long-term average. Record for the Salt River begins in 1913; data for 1913 not shown. Gaps in plots after 1914 indicate data are not available.
 | Table 1. Chronology of major and other memorable floods and droughts in Arizona, 1862–2005 |
|||
| [Modified from Paulson and others, 1991] | |||
| Flood or drought | Date | Area affected | Remarks |
| Flood | Jan. 19–23, 1862 | Gila and Colorado Rivers | Severe at Yuma. Wet year in Verde and Bright Angel Basins, but not in upper Salt River Basin |
| Flood | Feb. 18–26, 1891 | Central Highlands | Phoenix and Yuma flooded. In Clifton, 18 deaths, $1 million in damage |
| Flood | Nov. 27–30, 1905 | San Francisco to Verde Rivers | Several severe to moderate floods, particularly at Phoenix and along the lower Gila River |
| Flood | Jan. 19–22, 1916 | Central Highlands | Intense rain on melting snow produced large flows in central Arizona; 4 deaths, $300,000 in damage |
| Flood | Aug. 21, 1921 | Phoenix (Cave Creek) | Six inches of rain in 2 days flooded 4,000 acres and the State capital building; $240,000 in damage |
| Flood | Sept. 27–29, 1926 | San Pedro River and Mexico | Tropical storm. Peak flow 2–3 times any other in 70 years; $450,000 in damage |
| Drought | 1932–36 | Statewide | Effects differed among basins |
| Flood | Mar. 14–15, 1941 | Central Arizona | One of several storms that caused general runoff and filled reservoirs |
| Drought | 1942–64 | Statewide | Severe long-term drought interrupted by several wet periods |
| Flood | Sept. 26–28, 1962 | Brawley and Santa Rosa Washes | 1 death; $3 million in damage, mostly to agriculture near Casa Grande |
| Flood | Dec. 22 1965 to Jan. 2, 1966 | Verde, Salt, and Gila Rivers and Rillito Creek | First large flow through Phoenix since reservoirs were built on Verde River (1939); $10 million in damage |
| Flood | Dec. 5–7, 1966 | Grand Canyon to southwestern Utah | Mudflows and channel erosion damaged Indian ruins that had been undisturbed for 800 years |
| Flood | Sept. 5–7, 1970 | Tonto Creek to Hassayampa River | Labor Day weekend floods in recreation areas. Reservoirs stored most runoff; 23 deaths, $8 million in damage |
| Flood | Oct. 17–21, 1972 | Upper Gila River | Tropical storm; 8 deaths, $10 million in damage |
| Drought | 1974–77 | Statewide | Most severe in eastern Arizona |
| Flood | July 17, 1974 | Safford (Holyoke Wash) | Thunderstorm produced flow of 1,740 cubic feet per second from 0.85-square-mile drainage basin |
| Flood | Oct. 1977 to Feb. 1980 | Central and southeastern Arizona | Seven regional floods. Phoenix declared a disaster area three times; 18 deaths, $310 million in damage |
| Flood | July 26, 1981 | Tucson (Tanque Verde Falls) | Flash flood at recreation area on Sunday; 8 deaths. Two larger peak discharges in the same week were not noticed |
| Flood | June 20 to Aug. 7,1983 | Colorado River | Upper basin rain and snowmelt. First reservoir spill since Hoover Dam was built (1935); $80 million in damage |
| Flood | Oct. 1–3, 1983 | Santa Cruz to San Francisco Rivers | Record floods on 18 streams; two peak discharges doubled 65-year-old records; 8 deaths, $226 million in damage |
| Flood | Winter 1993 | Statewide | Resulted from extremely intense El Niño; breach of Gillespie Dam on Gila River |
| Drought | 1999–present (2005) | Statewide | Extensive and abundant fires (Rodeo-Chedeski fire, for example) and decreased water supplies statewide |
Precipitation in Arizona is biseasonal, having both winter and summer regimes (Hereford and others, 2002). The moisture comes from three major sources: (1) Pacific winter frontal storms that can produce significant snowpack in northern Arizona as well as flooding in the central and southern parts of Arizona, (2) subtropical Pacific moisture (dissipating hurricanes or tropical storms) that is generally warmer and can produce regional flooding of large magnitude, and (3) convective storms that occur throughout the State during the summer months. The location and intensity of convective storms are difficult to predict as the storms can form quickly and produce large amounts of precipitation in localized areas. They also generally result in flooding in smaller basins and urban areas, but are not significant for production of higher flows in main-stem river systems (Paulson and others, 1991).
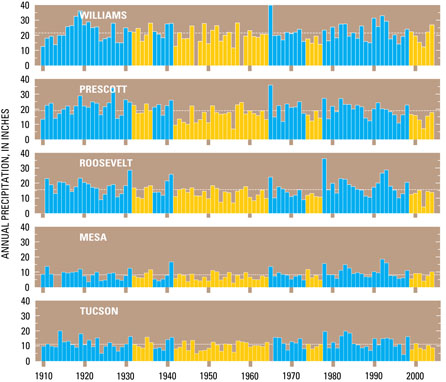 Figure 3. Annual precipitation at five long-term stations in Arizona. Drought periods shown in gold; horizontal line rejpresents long-term average. Gaps in plot after 1910 indicate data are not available.
 Precipitation data acquired by the National Weather Service can serve as an indicator of drought and flood conditions. Data acquired at five long-term precipitation stations in different parts of Arizona indicate that precipitation during the last 6 years was below the long-term average (fig. 3).
Streamflow in water years (WY) 1999–2004 was compared to historical streamflow data for 20 streamflow-gaging stations in Arizona for this report (table 2 and fig. 1). Included in the 20 stations are 10 long-term stations, as well as an additional 10 medium- to long-term stations (fig. 1). These 20 stations are considered index stations because they have medium to long periods of record and are little affected by flow diversions. The data for the period 1999–2004 for these 20 stations, when compared to historical data, indicate WY 2000 and WY 2002 were two of the driest years during the period of record. Annual discharge for almost all sites for individual years from 1999 to 2004 was well below long-term average conditions, indicating statewide drought conditions since the beginning of WY 1999 (October 1998). Annual discharge exceeded the long-term average only 6 times at the 20 sites from WY 1999 through WY 2004 (table 2). Annual discharge for the 20 sites over this same period of time was less than 10 percent of the average annual discharge 17 times and less than 50 percent 83 times. The drought of 1999–2004 is considered the most severe drought in Arizona since the early 1940s and possibly earlier (table 1). The average streamflow during three drought periods—1942–64, 1974–77, and 1999–2004—was compared to average streamflow for the 10 long-term index stations. Streamflow at the stations was 45 percent of the long-term flow during 1999–2004, 53 percent during 1974–77, and 68 percent during 1942–64 (fig. 2). Data for 1932–36 were insufficient for comparisons with data for 1999–2004.
| Table 2. Percentage of average annual discharge for 20 selected streamflow-gaging stations during water years 1999–2004 | |||||||||
| Site | Number | Site Name | Period of Record | Percentage of average annual mean discharge for indicated water year |
|||||
| 1999 | 2000 | 2001 | 2002 | 2003 | 2004 | ||||
| 1 | 09382000 | Paria River at Lees Ferry | 1924–2004 | 109 | 41 | 96 | 39 | 57 | 62 |
| 2 | 09512500 | Agua Fria River near Mayer | 1940–2004 | 49 | 17 | 38 | 40 | 34 | 17 |
| 3 | 09508500 | Verde River below Tangle Creek | 1946–2004 | 51 | 36 | 65 | 32 | 68 | 40 |
| 4 | 09499000 | Tonto Creek above Gun Creek, near Roosevelt | 1941–2004 | 24 | 8.0 | 58 | 3.1 | 52 | 17 |
| 5 | 09384000 | Little Colorado River above Lyman Lake | 1941–2004 | 65 | 17 | 88 | 15 | 33 | 44 |
| 6 | 09498500 | Salt River near Roosevelt | 1914–2004 | 40 | 22 | 70 | 23 | 70 | 41 |
| 7 | 09468500 | San Carlos River near Peridot | 1930–2004 | 29 | 18 | 45 | 11 | 56 | 17 |
| 8 | 09444500 | San Francisco River at Clifton | 1928–2004 | 67 | 26 | 150 | 33 | 37 | 44 |
| 9 | 09448500 | Gila River at head of Safford Valley | 1921–2004 | 62 | 26 | 130 | 31 | 38 | 49 |
| 10 | 09480500 | Santa Cruz River near Nogales | 1931–2004 | 45 | 12 | 205 | 4.0 | 5.0 | 1.6 |
| 11 | 09490500 | Black River near Fort Apache | 1958–2004 | 31 | 13 | 73 | 15 | 66 | 40 |
| 12 | 09496500 | Carrizo Creek near Show Low | 1952–2004 | 18 | 11 | 28 | 35 | 55 | 26 |
| 13 | 09424450 | Big Sandy River near Wikieup | 1967–2004 | 5.0 | 3.8 | 61 | 4.1 | 13 | 44 |
| 14 | 09397500 | Chevelon Creek below Wildcat Canyon | 1948–2004 | 17 | 6.7 | 80 | 0 | 48 | 24 |
| 15 | 09504500 | Oak Creek near Cornville | 1941–2004 | 55 | 41 | 63 | 34 | 83 | 55 |
| 16 | 09510200 | Sycamore Creek near Fort McDowell | 1961–2004 | 5.0 | .61 | 52 | .23 | 36 | 2.7 |
| 17 | 09505350 | Dry Beaver Creek near Rimrock | 1961–2004 | 25 | 5.0 | 48 | .8 | 77 | 20 |
| 18 | 09485000 | Rincon Creek near Tucson | 1953–2004 | 25 | 17 | 190 | 4.4 | 14 | 45 |
| 19 | 09497980 | Cherry Creek near Globe | 1966–2004 | 35 | 16 | 53 | 12 | 35 | 16 |
| 20 | 09379200 | Chinle Creek near Mexican Water | 1965–2004 | 110 | 19 | 49 | 74 | 34 | 43 |
Although streamflows generally were low in Arizona during 1999–2004, floods during the winter of 2005 were substantial—to the point of filling reservoirs in central Arizona. The climate of Arizona, however, naturally tends to extremes—large floods and severe drought conditions are common. Determining whether this was an interruption to a longer drought, or the beginning of wetter years in Arizona, therefore, is difficult. Data acquired at 20 medium- to long-term streamflow-gaging stations, however, indicate the period 1999–2004 was the driest since the early 1940s and possibly earlier.
Hereford, R., Webb, R.H., and Graham, S., 2002, Precipitation history of the Colorado Plateau region: U.S. Geological Survey Fact Sheet 119–02, 4 p.
Paulson, R.W., Chase, E.B., Roberts, R.S., Moody, D.W., 1991, National Water Summary 1988–89, Hydrologic events and floods and droughts: U.S. Geological Survey Water-Supply Paper 2375, p. 181–188.
Current streamflow conditions in Arizona can be obtained from
http://waterdata.usgs.gov/az/nwis/rt
Historical streamflow conditions can be obtained from
http://waterdata.usgs.gov/az/nwis/sw
For more information contact:
U.S. Geological Survey
Arizona Water Science Center
520 N. Park Ave., Suite 221
Tucson, Arizona 85719
Telephone: (520) 670-6671 x261
Fax: (520) 670-5592
E-mail: jvphill@usgs.gov
This report is available online in Portable Document Format (PDF). If you do not have the Adobe Acrobat PDF Reader, it is available for free download from Adobe Systems Incorporated.
Document Accessibility: Adobe Systems Incorporated has information about PDFs and the visually impaired. This information provides tools to help make PDF files accessible. These tools convert Adobe PDF documents into HTML or ASCII text, which then can be read by a number of common screen-reading programs that synthesize text as audible speech. In addition, an accessible version of Acrobat Reader 5.0 for Windows (English only), which contains support for screen readers, is available. These tools and the accessible reader may be obtained free from Adobe at Adobe Access.
For more information about USGS activities in Arizona, visit the USGS Arizona District home page.
| AccessibilityFOIAPrivacyPolicies and Notices | |
 |
|