
Fact Sheet 2005-3094
July 2005
Prepared in cooperation with the cities of Minneapolis, St. Paul, and St. Cloud, Minnesota, and in collaboration with the Minnesota Department of Health, Minnesota Pollution Control Agency, Stearns County, Minnesota, and the Upper Mississippi River Source Water Protection Project.
The cities of Minneapolis, St. Paul, and St. Cloud, Minnesota rely primarily on the Mississippi River for their public drinking water supplies. In 1996, Congress passed the Safe Drinking Water Act (SDWA) Amendments that established the Source Water Protection Program. These amendments require that States prepare Source Water Assessments for public water suppliers that draw drinking water from surface waters. In 1998, the Minnesota Pollution Control Agency (MPCA) provided support to the "Upper Mississippi River Source Water Protection Project," through which the Minnesota Department of Health (MDH) and the cities of Minneapolis, St. Paul, and St. Cloud, Minnesota collaboratively prepared Source Water Assessments for each of the cities.
Although not required by the SDWA Amendments, Minneapolis, St. Paul, and St. Cloud are currently (2005) developing Source Water Protection Plans in collaboration with the MPCA. The focus of these plans is the (1) delineation of Source Water Protection Areas, (2) identification of potential contaminant threats to their source water, and (3) development of management strategies and measures in response to these threats.
The delineation of the Source Water Protection Areas for Minneapolis, St. Paul, and St. Cloud has been completed (Minnesota Pollution Control Agency, 2001). These protection areas include (1) an inner high priority area within which a contaminant release could pose an immediate threat to public health that could require closure of the water intakes, (2) an outer area within which a contaminant release could pose a longer-term threat to public health, and (3) the entire basin upstream from an intake. The protection areas are based primarly on traveltimes from the point of a potential contaminant release to water intakes; the goal is to give managers the opportunity to maximize finished water storage and/or to close the intake(s). The protection areas for Minneapolis, St. Paul, and St. Cloud which are by design contiguous with one another, have been combined into a "Composite Source Water Protection Area." (fig. 1,).
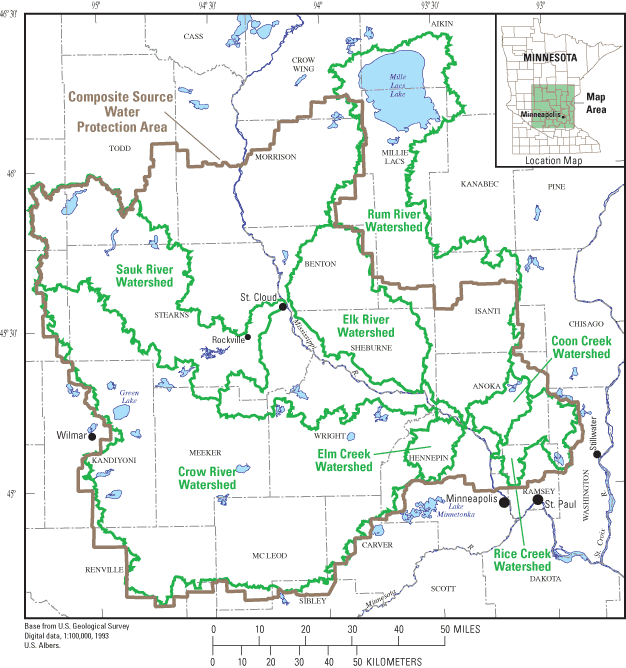
In order to be effective in protecting drinking-water supplies the Source Water Protection Plans need to be based on reliable hydrologic information and coordinated effectively though interagency communication. Understanding traveltimes in the streams that flow into the Mississippi River is a necessary part of the plans because delineation of Source Water Protection Areas, particularly within the inner area, is based primarily on the transport time of potential contaminants to a water intake. Source Water Protection Plans were based, in part, on results of a study by the U.S. Geological Survey (USGS) of traveltimes in seven Mississippi River tributaries upstream from the cities (Arntson and others, 2004). This study was done in cooperation with Minnesota Department of Health, and the cities of Minneapolis, St. Paul and St. Cloud. As described in this fact sheet, an accidental release of liquid manure in April 2004, upstream from the St. Cloud water-treatment facility, demonstrated the value of reliable hydrologic information and interagency coordination among all levels of government in responding to events that threaten supplies of public water.
Traveltime estimates for streams are based on stream velocity, flow conditions, and the physical characteristics of the stream channel. Traveltimes also vary over time and with stream discharge. Increased streamflow decreases traveltime and expands the size of delineated source-water-protection areas. Decreased streamflow increases traveltime and reduces the size of delineated source water protection areas.
Traveltimes for seven of the primary streams tributary to the Mississippi River, which are within the Composite Source Water Protection Area, were estimated using equations developed by Jobson (1996). Estimation of traveltime required information about drainage area, river slope, and annual mean discharge. Traveltimes were estimated in each of the seven tributary streams. As an example, the estimated traveltimes for the Sauk River are presented in table 1. The technique provided a method to estimate: (1) the rate of movement of a contaminant through a reach of the river; (2) the attenuation of the peak concentration of a conservative contaminant with time; and (3) the time required for the contaminant plume to pass a point in the river (Arntson and others, 2004).
Table 1. Comparison of estimated and measured traveltimes for reaches in the Sauk River
[ft3/s, cubic feet per second; --, no data]
| Distance upstream from mouth, in feet | Measured or planned-flow, in ft3/s | Traveltime of peak concentration, in hours | Traveltime to leading edge, in hours | Duration of solute, in hours | Total travel- time to trailing edge, in hours | ||||||
|---|---|---|---|---|---|---|---|---|---|---|---|
| Sauk River - Estimated traveltimes from slug1 at Rockville | |||||||||||
| County Road 1 | 328 | 457 | 11.9 | 10.6 | 4.0 | 14.6 | |||||
| Veterans Drive | 21,800 | 457 | 9.4 | 8.4 | 3.4 | 11.8 | |||||
| County Road 121 | 51,000 | 457 | 5.0 | 4.4 | 2.1 | 6.6 | |||||
| County Road 139 (Rockville) | 83,000 | 457 | 0.0 | 0.0 | 0.0 | 0.0 | |||||
| Sauk River - Measured traveltimes from dye injection at Rockville, June 16, 2003, at 11:15 hours | |||||||||||
| County Road 1 | 328 | -- | 15.5 | 13.4 | 7.1 | 20.5 | |||||
| Veterans Drive | 21,800 | -- | 11.8 | 9.9 | 5.6 | 15.5 | |||||
| County Road 121 | 51,000 | -- | 5.9 | 5.0 | 3.6 | 8.5 | |||||
| County Road 139 (Rockville) | 83,000 | 457 | 0.0 | 0.0 | 0.0 | 0.0 | |||||
1 Based on method described by Jobson (1996)
The traveltime estimates were evaluated with the dye-trace study in the Sauk River to verify the reliability of the equations. The dye-trace was conducted by the USGS during the summer of 2003 (figs. 2 and 3). A harmless luminescent dye (Rhodamine WT) was tracked in the Sauk River from the city of Rockville to the confluence with the Mississippi River near the St. Cloud water intakes on the Mississippi River, a distance of approximately 16 miles. Dye concentrations were measured and tracer-response curves were developed to determine times of peak concentrations and traveltimes (table 1 and fig. 4). Water samples at the St. Cloud water intakes on the Mississippi River showed that approximately 30 percent of the water entering St. Cloud's intake at the time of the study was contributed by the Sauk River, even though the Sauk River contributed only 10 percent of the flow in the Mississippi River by volume. The disproportionate flow at the intake was due to the way the Sauk River flow stays near the west bank of the Mississippi River as it flows past the water intakes.
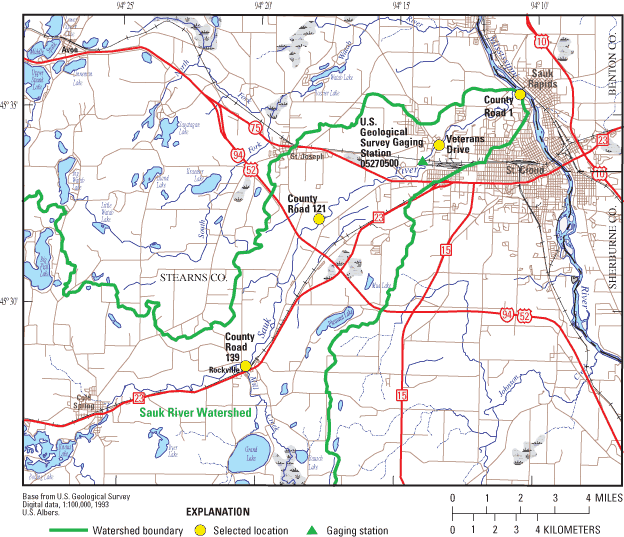
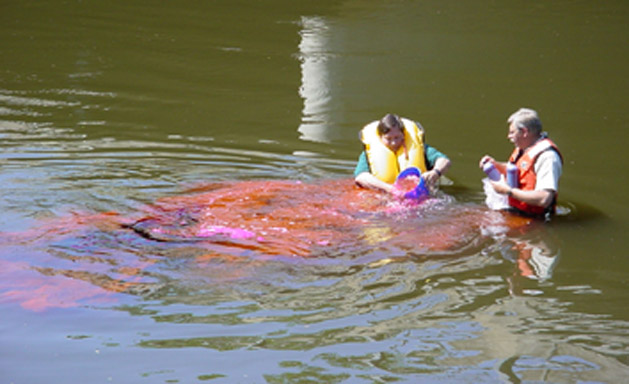
Figure 3. Dye release to Sauk River. Photograph by J.R. Stark, U.S. Geological Survey.
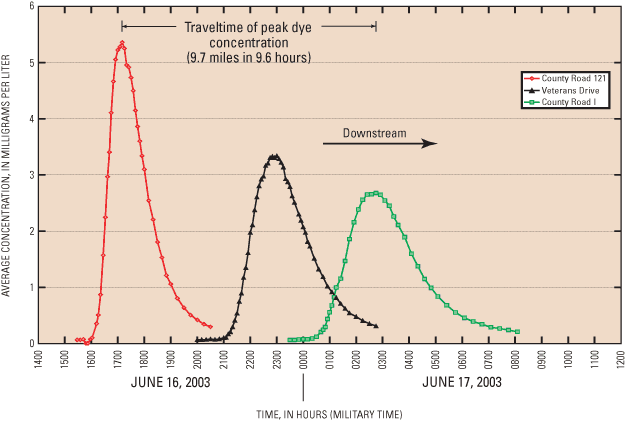
Figure 4. Measured tracer-responce curve for three Sauk River locations.
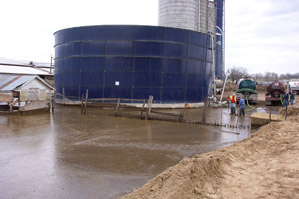
In April 2004, 125,000 gallons of liquid cattle manure were accidentally released into Mill Creek (figs. 2, 5 and 6), near its confluence with the Sauk River, which flows into the Mississippi River just upstream from the St. Cloud water intakes. The events that followed the incident are a good example of the importance of reliable hydrologic information and of interagency communication and cooperation in responding to contaminant releases that threaten public water supplies.
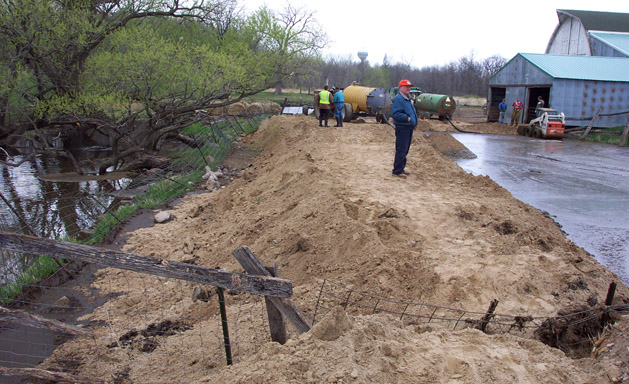
As the result of prompt communication and action, staff from the city of St. Cloud and Stearns County responded quickly to the incident. The local fire department coordinated construction of an earthen containment dike, limiting releases to Mill Creek. Manure that entered the creek traveled 16 miles downstream in the Sauk River, to the confluence with the Mississippi River, just upstream from St. Cloud's water intakes. Estimates of the time that would elapse before the contaminants reached St. Cloud (16 hours) were provided by the USGS, based on traveltime estimates (Arntson and others, 2004) and flow conditions existing at the time. Based on this estimate, water intakes were closed as the plume passed. Staff from the Minnesota Department of Natural Resources (MDNR) and the city of St. Cloud measured movement of the contaminants as they passed the intakes. The traveltime estimates were found to be accurate, based on fecal coliform testing at the intake. The duration of the plume was approximately 6 hours at the intakes and they were closed for 8 hours. With the estimated streamflow of the Mississippi River at the time of the spill of 6,300 cubic feet per second (ft3/s), compared to the flow of the Sauk River of 213 ft3/s, based on data from USGS gaging stations, the plume was substantially diluted in the Mississippi River as it traveled downstream in the Mississippi River.
After the release, staff from the MPCA and Stearns County directed cleanup activities. In total, an estimated 750,000 gallons of manure, marl, and water were pumped from Mill Creek. The removal of the residual manure from the creek channel was instrumental in the quick recovery of the water quality in Mill Creek. Three days after the manure spill, dissolved oxygen levels in Mill Creek returned to normal and water clarity was good.
Stearns County has increased educational efforts for management and maintenance of Liquid Manure Storage Structures (LMSS) as a result of the 2004 cattle manure release. Currently (2005), there are about 705 LMSS in the county. However, only 418 of these are permitted by County or MPCA officials. The County has modified zoning ordinances to ensure that new LMSS meet minimum structural setback requirements to protect streams and lakes from possible future releases of liquid cattle manure (Robert L. Sip, Stearns County Environmental Services, electronic communication, 2005).
This incident provides a good example of the social benefit of planning programs, such as nonpoint studies, and the importance of reliable hydrologic information (fig. 7) and the application of information and technical tools for a coordinated response to a contaminant release to protect water supplies. Collaborative source water protection efforts, as well as traveltime estimates, provided a solid technical basis for responding to the release. Interagency communication and coordination allowed the city of St. Cloud to maximize finished water storage and to close its water intake prior to arrival of the contaminant plume. The availability of traveltime data provided the foundation for Source Water Protection Plans for each of the cities and provided an important tool in protecting St. Cloud's public drinking-water supply.
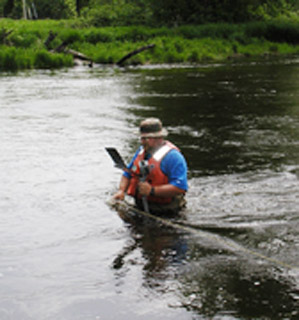
Figure 7. Streamflow measurement, Sauk River. Photograph by Katie Barnella, U.S. Geological Survey.
Arntson, A.D., Lorenz, D.L., and Stark, J. R., 2004, Estimation of travel times for several tributaries of the Mississippi River, St. Cloud to Minneapolis, Minnesota, 2003: U.S. Geological Survey Scientific Investigations Report 2004-5192, 17 p.
Jobson, H.E., 1996, Prediction of travel time and longitudinal dispersion in rivers and streams: U.S. Geological Survey Water-Resources Investigations Report 96-4013, 69 p.
Kilpatrick, F.A., 1993, Simulation of soluble waste transport and buildup in surface waters using tracers: U.S. Geological Survey Techniques of Water-Resources Investigations, book 3, chap. A20, 37 p.
Kilpatrick, F.A., and Taylor, K.R., 1986, Applications of dispersion data: Water Resources Bulletin of the American Water Resources Association, v. 22, no. 4, p. 537-548.
Kilpatrick, F.A., and Wilson, J.F., Jr., 1989, Measurement of time of travel in streams by dye tracing: U.S. Geological Survey Techniques of Water-Resources Investigations, book 3, chap. A9, 27 p.
Minnesota Pollution Control Agency, 2001, Upper Mississippi River Source Water Protection Initiative—Integration of Source Water Protection and Non-point Management: Minnesota Pollution Control Agency Clean Water Partnership Diagnostic Phase Project, Final Report, April 1997 —September 2001, 56 p. plus appendixes.
Payne, G.A., 1995, Ground-water base flow to the Upper Mississippi River upstream of the Minneapolis-St. Paul area, Minnesota during July 1988: U.S. Geological Survey Open File Report 94-478, 28 p.
U.S. Army Corps of Engineers, 1994, Water available from the Mississippi River at Minneapolis and other upstream Minnesota locations during low flow conditions: St. Paul Disctict, 29 p. plus appendixes.
U.S. Army Corps of Engineers, 1997, Mississippi River Defense Network Spill Response Manual: St. Paul District, 91 p., plus appendixes.
Wilson, J.F., Cobb, E.D., Kilpatrick, F., 1986, Fluorometric procedures for dye tracing (rev.): U.S. Geological Survey Techniques of Water-Resources Investigations, book 3, chap. A12, 34 p.
—J.R. Stark, A.D. Arntson, U.S. Geological Survey; and D.L. Brostrom, David L. Brostrom Consulting Services| AccessibilityFOIAPrivacyPolicies and Notices | |
 |
|