Fact Sheet 2006–3042

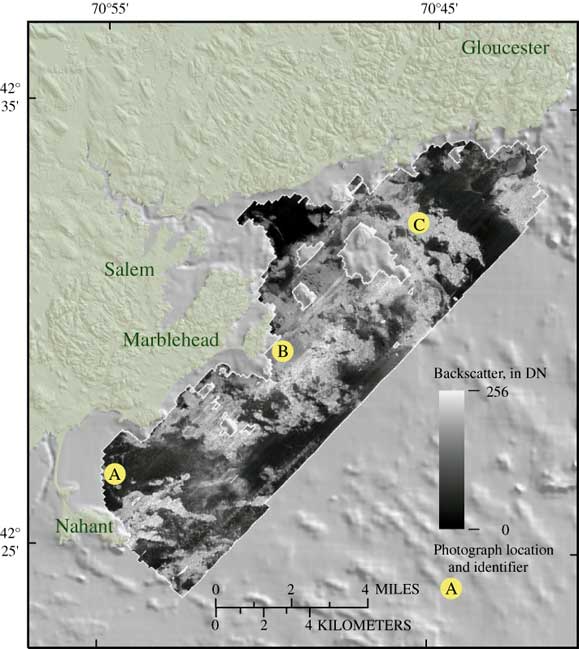
Figure 3. Backscatter image of seafloor, produced with sidescan sonar. Backscatter values within this image indicate the strength of sound waves reflected off the seafloor and are represented by digital numbers (DN) that range from 0 to 256. High backscatter (light tones) is associated with generally coarse sediment and rock outcrops. Low backscatter (dark tones) is associated with generally fine-grained mud and fine sand. Broad areas of dark-toned, finer sediment correlate with areas of smooth topography in figure 2; light-toned rocky areas correlate with areas of high– relief topography. Yellow circles indicate the locations of three photographs shown in figure 5 A–C.
A shaded relief map that is overprinted with a backscatter image of the Massachusetts inner shelf from Gloucester to Nahant. Backscatter is depicted as 256 shades of gray in DN units from 0 (black) to 256 (white). Yellow circles indicate the locations of bottom photographs in figure 5, and are evenly spaced along the coastal area.