New Jersey Water Science Center
New Jersey Tide Telemetry SystemBy Heidi L. HoppeFact Sheet 2007-3064ONLINE ONLY |
 |
This publication is downloadable in PDF format. (Size: 2.9Mb) To view or print PDF files, the freely downloadable Adobe Acrobat Reader® may be used. |
Each summer the population of the barrier-island communities of New Jersey increases by tens of thousands. When a coastal storm threatens these communities, the limited number of bridges and causeways that connect the islands with the mainland become overcrowded, making evacuations from the barrier islands to the mainland difficult. Timely evacuation depends on well-defined emergency evacuation plans used in conjunction with accurate flood forecasting and up to the minute (real-time) tide-level information.
The “Great Nor’easter” storm that struck the coastal areas of New Jersey on December 11, 1992, caused about $270 million in insured damages to public and private property (Dorr and others, 1995). Most of the damage was due to tidal flooding and storm surge, which were especially severe along the back bay areas. Comprehensive and reliable tide-level and meteorological data for the back bays was needed to make accurate flood forecasts.
Collection of tidal data for the ocean and large bays was adequately covered by the National Oceanic and Atmospheric Administration’s National Ocean Service (NOAA’s NOS), but in New Jersey little to no data are available for the back-bay areas. The back bays behave quite differently than the ocean as a result of the complex interaction between the winds and the geometry of the inlets and bays. A slow moving Nor’easter can keep tide levels in back bays several feet higher than the ocean tide by not allowing tides to recede, resulting in flooding of bridges and causeways that link the barrier islands to the mainland.
The U.S. Geological Survey (USGS), in cooperation with the New Jersey Department of Transportation (NJDOT), designed and installed the New Jersey Tide Telemetry System (NJTTS) with assistance from NOAA’s NOS in 1997. This system is part of a statewide network of tide gages, weather stations, and stream gages that collect data in real time. The NJTTS supplies comprehensive, reliable real-time tide-level and meteorological data for flood-prone areas along the New Jersey shore and back bays. These data are transmitted to computer base stations located at offices of the National Weather Service, New Jersey State Police (NJSP), NJDOT, county emergency management agencies, other critical decision-making centers, and the World Wide Web (WWW). This fact sheet describes the NJTTS and identifies its benefits.
The study area covers the coastal regions of New Jersey, including the barrier islands, the back bays, the near-shore environment from Hackensack to Cape May, the Delaware Bay, and the Delaware River (fig. 1). Most of the area lies within the Coastal Plain Physiographic Province, which is characterized by elevations typically less than 100 feet above North American Vertical Datum of 1988 and by marshes bordering numerous streams and estuaries (Wolfe, 1977) (fig. 1). A small portion of the study area, in northeast New Jersey, lies within the Piedmont Physiographic Province (Wolfe, 1977).
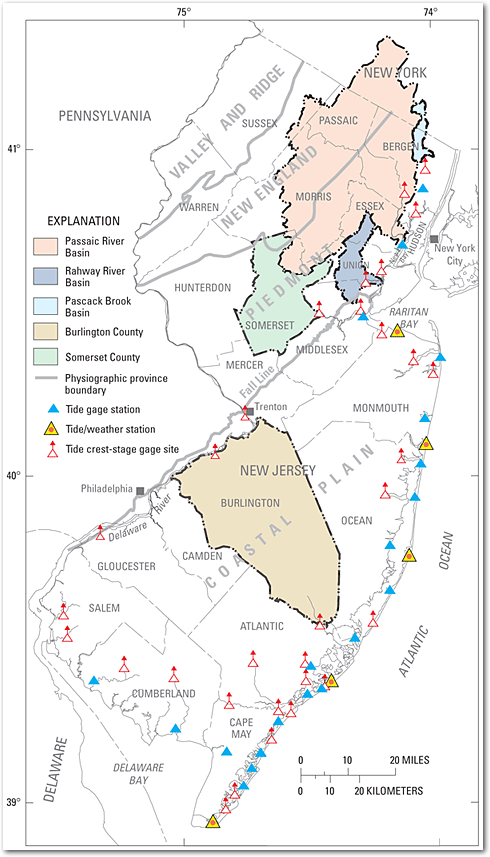
Figure 1. Locations of gages in the New Jersey Tide Telemetry System.
The NJTTS presently consists of 20 tide gages, 5 tide/weather stations, and 31 tidal crest-stage gages in 13 New Jersey counties, along the New Jersey shore and nearby areas (fig. 1, fig. 2, fig. 3, and fig. 4). The tide level at each of the tide gages is automatically measured at 6-minute intervals, stored by a data-collection platform (DCP), and transmitted by NOAA’s GOES (Geostationary Operational Environmental Satellite) satellite to the network of computer base stations and the World Wide Web. The data also are transmitted by telephone to specific critical decision-making centers. The weather stations measure, store, and transmit tide levels and meteorological data—rainfall, windspeed and direction, air and water temperature, relative humidity, and barometric pressure—using the same modes of telemetry. The tidal crest-stage gages, simple, non-mechanical devices that can only be read manually, record the peak tide level between inspections. These gages provide redundancy during primary sensor failure and verification of recorded peaks.
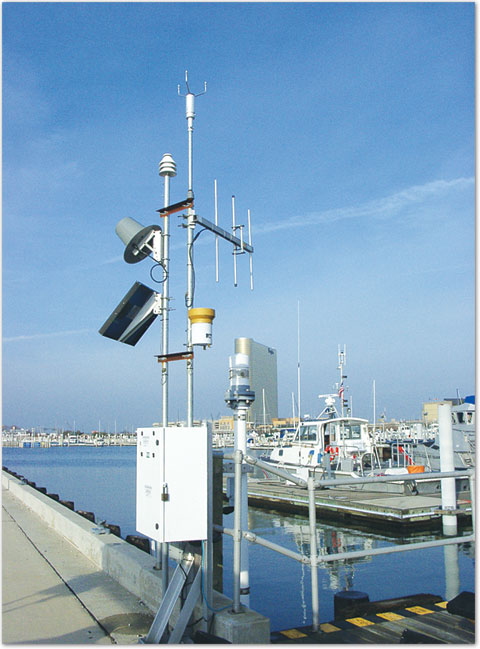
Figure 2. USGS tide gage/weather station at Absecon Channel in Atlantic City, NJ, which transmits tide-level and meteorologic data.
Precise land-surface elevations have been established for each location in the NJTTS. The elevations are part of a network of benchmarks, which are permanent markers on which a known elevation is established. The benchmarks are referenced to the North American Vertical Datum of 1988.
The base stations consist of computers and peripheral equipment, which receive, store, and translate the data transmitted by the gages. They are located in State, county, or municipal offices where they are available to emergency management personnel who use the real-time data to make immediate decisions about evacuation routes. The base stations associated with the NJTTS are located in the Offices of Emergency Management of Atlantic, Cape May, Cumberland, Monmouth, and Ocean Counties, as well as the NJDOT office in Trenton, N.J., and the regional offices.
At present (2007), five local flood-warning systems, in addition to the NJTTS, are in operation in New Jersey—the Burlington County Flood Warning System (BCFWS), the Pascack Brook Flood Warning System (PBFWS), the Passaic Flood Warning System (PFWS), the Rahway River Flood Warning System (RRFWS), and the Somerset County Flood Information System (SCFIS)(fig. 1).
The BCFWS, which has been in use since 1964, uses 10 stream stage and 3 precipitation gages to monitor stream levels and rainfall in Burlington County; the PBFWS, in use since 1998, uses 4 stream stage and 3 precipitation gages to monitor the Pascack Brook Basin; the PFWS, in use since 1903, uses 21 stream stage and 35 precipitation gages to monitor the Passaic River Basin; the RRFWS, in use since 1964, uses 7 stream stage and 3 precipitation gages in monitor the Rahway River Basin; and the SCFIS, in use since 1990, uses 28 stream stage and 21 precipitation gages to monitor Somerset County. Each system consists of automated stream gages and precipitation gages that are transmitted to computer base stations and the WWW by telephone, radio, and (or) satellite link.
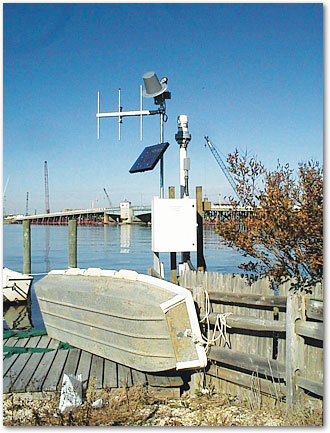
Figure 3. USGS tide gage at Barnegat Bay in Mantoloking, NJ, which transmits tide-level data.
Tide-level and meteorological data collected and transmitted by the NJTTS can be used in real time or stored and later retrieved by Federal, State, county, and municipal agencies, as well as the public, for a variety of purposes that benefit the residents of New Jersey.
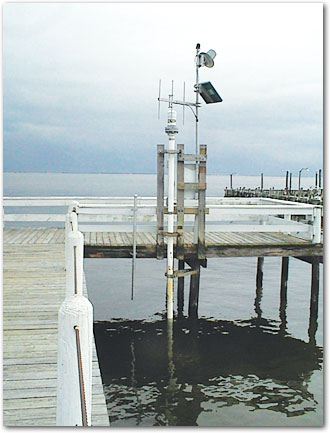
Figure 4. USGS tide gage at Barnegat Bay in Waretown, NJ, which transmits tide-level data.
The tide-level and meteorological data from this network, as well as data from gages which are part of the New Jersey statewide system, can be accessed on the WWW at the USGS New Jersey Water Science Center homepage at http://nj.usgs.gov/ under the heading Real-Time Data. A graph of the tide-level and meteorological data for the last 7 days (fig. 5) is available by clicking on a specific station. These data are also available on NOAA’s NWS Advanced Hydrologic Prediction Service (AHPS) website at http://www.weather.gov/ahps/ and at NOAA’s nowCOAST website at http://nowcoast.noaa.gov/. Real-time flood-warning data that are not transmitted by satellite, but rather by radio telemetry on an event reporting basis can be viewed at the Automated Flood Warning Systems website at http://www.afws.net/.
A new mode of accessing data from USGS real-time stations is through USGS StreamMail. This service provides immediate water information from the USGS Real-Time Network to devices such as cell phones and personal digital assistants. Send an email to streammail@usgs.gov with a USGS station number in the subject line and after a few minutes you will receive an e-mail with the most recent real-time stage and streamflow data.
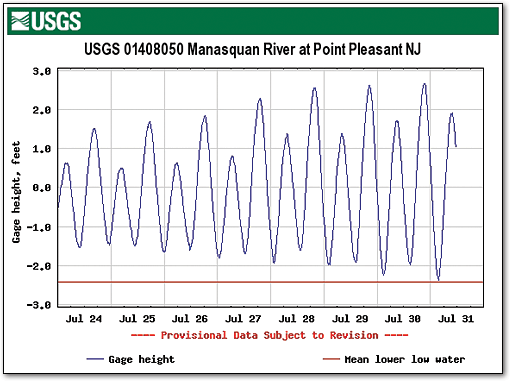
Figure 5. Example of an actual tide-level graph that can be viewed and printed from the Real-Time Data web page.
Dorr, R.A., Thurm, Harvey, Shaffer, Wilson, Kocin, Paul, Kramper, James, Kane, Richard, Graff, S.K., Budd, Bruce, Gabrielsen, Peter, Hrebanach, Stephen, 1995, The Great Nor’Easter of December 1992: National Weather Service Eastern Region, Disaster Survey Report, 112 p.
Wolfe, P.E., 1977, The geology and landscapes of New Jersey: New York, Crane, Russak and Company, Inc., 351 p.
For more information, contact:New Jersey Water Science Center On the web: http://nj.usgs.gov/ Email: DC_NJ@usgs.gov |
Partners in project:National Oceanic and Atmospheric Administration (NOAA) New Jersey Department of Transportation (NJDOT) New Jersey Office of Emergency Management (NJOEM) |
| AccessibilityFOIAPrivacyPolicies and Notices | |
 |
|