Dasymetric Mapping Techniques
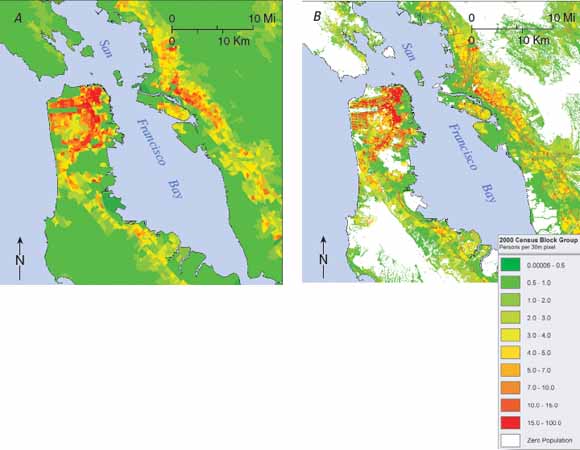
Visualization and spatial accuracy of population distribution are greatly improved by using a "dasymetric" mapping method. The U.S. Geological Survey (USGS) has developed a new dasymetric-mapping tool, which was used to create a map of the San Francisco Bay region. The left map (A) is a traditional "choropleth" map representing population by U.S. Census Bureau block-group, where the number of people are evenly distributed across each block-group, whereas the right map (B) is a dasymetric map that more accurately represents population by census block-group, where population density distribution is determined by ancillary data sets, providing the criteria for density parameters. These data sets include, a USGS National Land Cover Dataset, a USGS digital elevation model, and land-ownership and transportation data.
Human population counts are collected and commonly displayed uniformly across areas, such as U.S. Census Bureau block-groups and tracts. The limitation inherent in this type of representation is the assumption that people are evenly distributed across each areal unit, when in actuality many areas such as parks, open spaces, and industrial zones are uninhabited. The U.S. Geological Survey (USGS) has developed a geospatial tool that uses a “dasymetric” mapping method to redistribute census population values to homogenous, inhabited, zones, enhancing visualization and accuracy.
Download this report as a 2-page PDF file (fs2008-3010.pdf; 2.2 MB)
For questions about the content of this report, contact Rachel Sleeter
Download the Suggested citation and version history
Download a free copy of the latest version of Adobe Reader.
|
Help |
PDF help |
Publications main page |
| Western Fact Sheets |
| Geography |
Western Geographic Science Center
|
This report is available only on the Web.

![]() U.S. Department of the Interior | U.S. Geological Survey
U.S. Department of the Interior | U.S. Geological Survey
URL: https://pubs.usgs.gov/fs/2008/3010/
Page Contact Information: Michael Diggles
Page Last Modified: February 14, 2008
